
- Start >
- Rivers >
- Waterlevel >
- Isar >
- Burghausen >
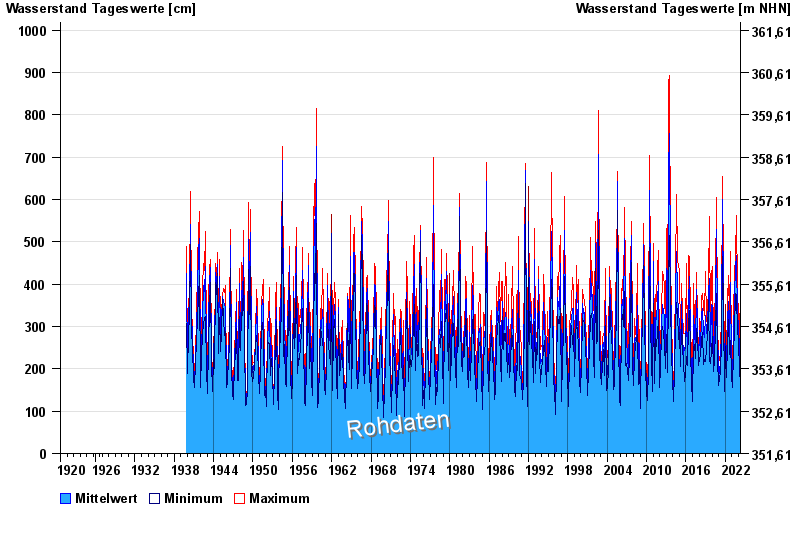
- Chart of total period

Chart of total period Burghausen / Salzach
Waterlevel from 30.08.1920 to 26.04.2024
| Date | Mean value [cm] | Maximum [cm] | Minimum [cm] |
|---|---|---|---|
| 26.04.2024 | 172 | 180 | 153 |
| 25.04.2024 | 179 | 189 | 152 |
| 24.04.2024 | 184 | 195 | 168 |
| 23.04.2024 | 186 | 205 | 165 |
| 22.04.2024 | 195 | 205 | 181 |
| 21.04.2024 | 193 | 208 | 186 |
| 20.04.2024 | 198 | 201 | 185 |
© Bayerisches Landesamt für Umwelt 2024