
- Start >
- Rivers >
- Waterlevel >
- Isar >
- Bad Wiessee >
- Chart of total period

Chart of total period Bad Wiessee / Söllbach
Waterlevel from 04.07.1991 to 26.04.2024
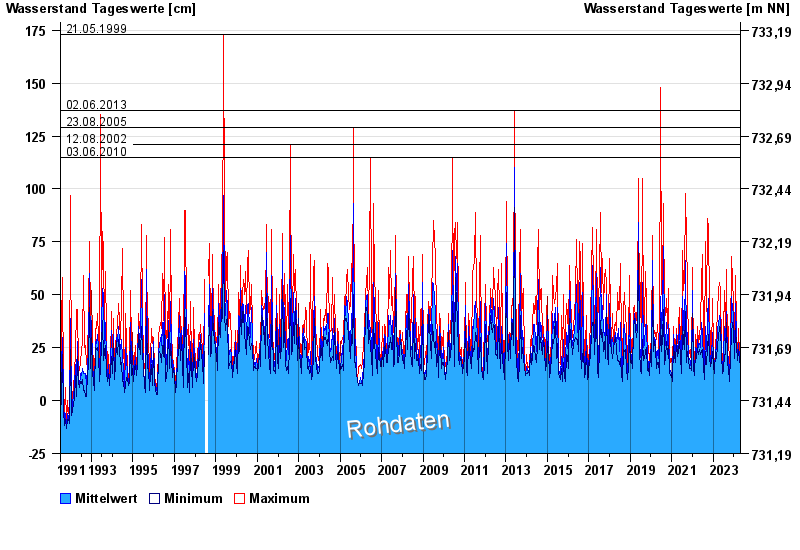
- 21.05.1999 Wasserstand: 173 cm
- 02.06.2013 Wasserstand: 137 cm
- 23.08.2005 Wasserstand: 129 cm
- 12.08.2002 Wasserstand: 121 cm
- 03.06.2010 Wasserstand: 115 cm
| Date | Mean value [cm] | Maximum [cm] | Minimum [cm] |
|---|---|---|---|
| 26.04.2024 | 15 | 16 | 15 |
| 25.04.2024 | 15 | 16 | 14 |
| 24.04.2024 | 15 | 16 | 15 |
| 23.04.2024 | 15 | 16 | 15 |
| 22.04.2024 | 16 | 18 | 16 |
| 21.04.2024 | 17 | 18 | 17 |
| 20.04.2024 | 20 | 22 | 18 |
© Bayerisches Landesamt für Umwelt 2024