
- Start >
- Rivers >
- Waterlevel >
- Isar >
- Bad Wiessee >
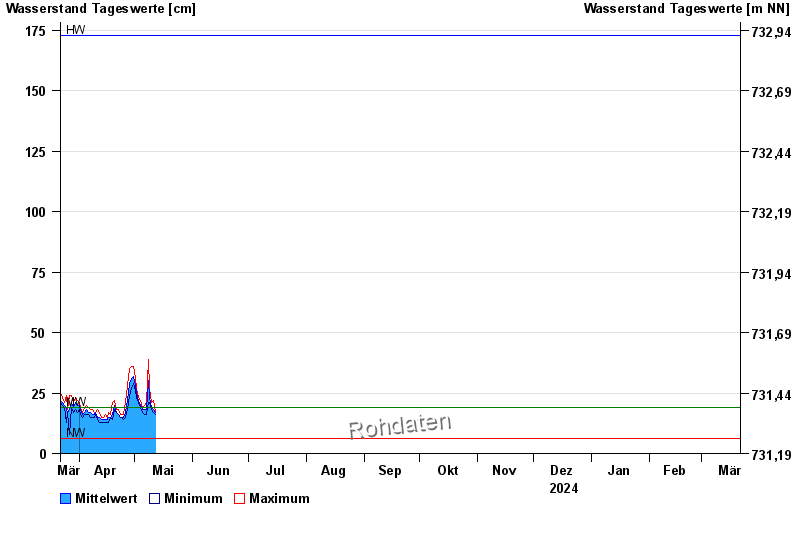
- Chart of year

Chart of year Bad Wiessee / Söllbach
Waterlevel from 22.03.2024 to 21.03.2025
| Date | Mean value [cm] | Maximum [cm] | Minimum [cm] |
|---|---|---|---|
| 12.05.2024 | 16 | 17 | 15 |
| 11.05.2024 | 18 | 22 | 17 |
| 10.05.2024 | 19 | 21 | 18 |
| 09.05.2024 | 23 | 27 | 21 |
| 08.05.2024 | 30 | 39 | 21 |
| 07.05.2024 | 18 | 21 | 16 |
| 06.05.2024 | 18 | 20 | 16 |
© Bayerisches Landesamt für Umwelt 2024