
- Start >
- Rivers >
- Waterlevel >
- Isar >
- Bad Trißl >
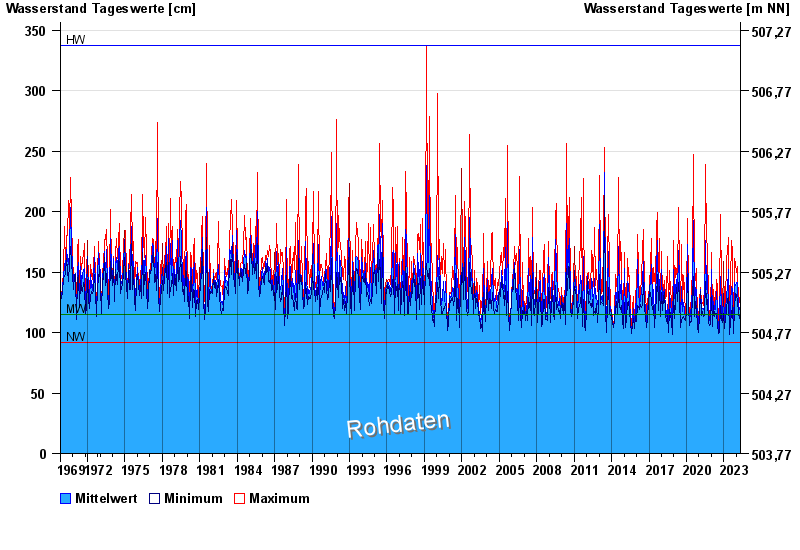
- Chart of total period

Chart of total period Bad Trißl / Auerbach
Waterlevel from 01.11.1969 to 30.04.2024
| Date | Mean value [cm] | Maximum [cm] | Minimum [cm] |
|---|---|---|---|
| 30.04.2024 | 111 | 115 | 109 |
| 29.04.2024 | 116 | 122 | 114 |
| 28.04.2024 | 123 | 128 | 119 |
| 27.04.2024 | 120 | 130 | 113 |
| 26.04.2024 | 113 | 122 | 108 |
| 25.04.2024 | 108 | 111 | 106 |
| 24.04.2024 | 106 | 108 | 106 |
© Bayerisches Landesamt für Umwelt 2024