
- Start >
- Rivers >
- Waterlevel >
- Isar >
- Bad Tölz >
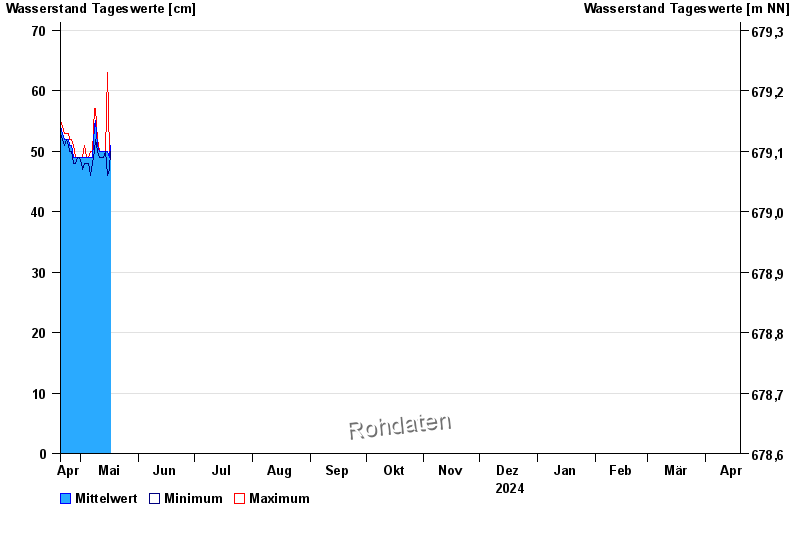
- Chart of year

Chart of year Bad Tölz / Ellbach
Waterlevel from 20.04.2024 to 19.04.2025
- 21.05.1999 Wasserstand: 123 cm
- 23.07.1966 Wasserstand: 116 cm
- 10.09.2010 Wasserstand: 112 cm
- 18.06.1979 Wasserstand: 107 cm
- 02.06.2013 Wasserstand: 106 cm
| Date | Mean value [cm] | Maximum [cm] | Minimum [cm] |
|---|---|---|---|
| 07.06.2024 | 58 | 59 | 57 |
| 06.06.2024 | 58 | 59 | 56 |
| 05.06.2024 | 61 | 67 | 56 |
| 04.06.2024 | 80 | 97 | 67 |
| 03.06.2024 | 82 | 99 | 61 |
| 02.06.2024 | 69 | 78 | 62 |
| 01.06.2024 | 77 | 82 | 65 |
© Bayerisches Landesamt für Umwelt 2024