
- Start >
- Rivers >
- Waterlevel >
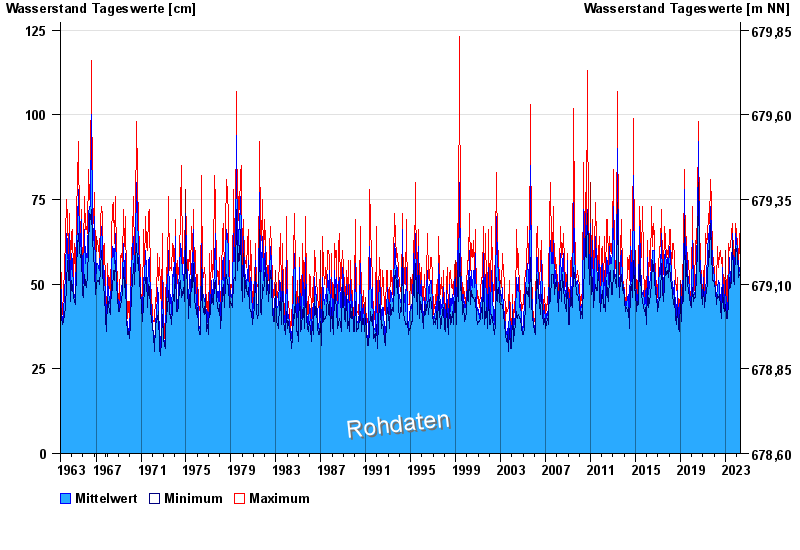
- Isar >
- Bad Tölz >
- Chart of total period

Chart of total period Bad Tölz / Ellbach
Waterlevel from 01.11.1963 to 07.05.2024
| Date | Mean value [cm] | Maximum [cm] | Minimum [cm] |
|---|---|---|---|
| 07.05.2024 | 50 | 50 | 48 |
| 06.05.2024 | 49 | 50 | 46 |
| 05.05.2024 | 49 | 49 | 48 |
| 04.05.2024 | 49 | 49 | 48 |
| 03.05.2024 | 49 | 51 | 48 |
| 02.05.2024 | 49 | 49 | 47 |
| 01.05.2024 | 49 | 49 | 48 |
© Bayerisches Landesamt für Umwelt 2024