
- Start >
- Rivers >
- Waterlevel >
- Isar >
- Bad Feilnbach >
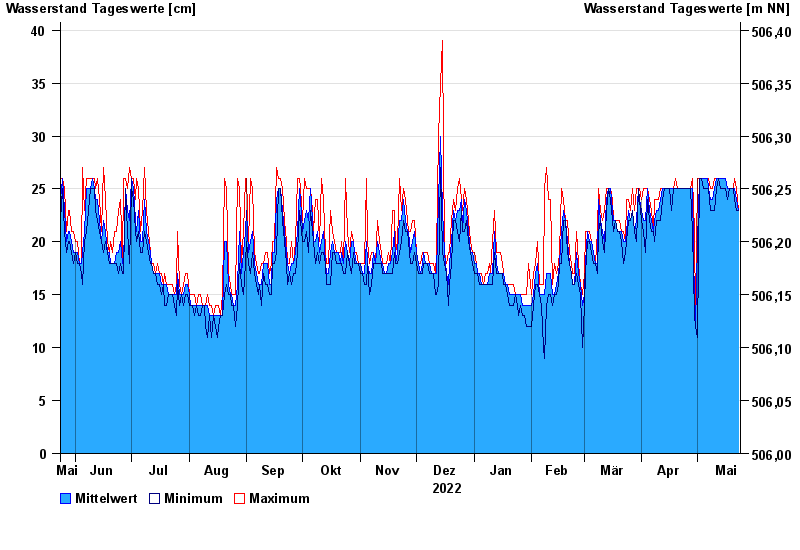
- Chart of year

Chart of year Bad Feilnbach / Mühlbach
Waterlevel from 24.05.2022 to 23.05.2023
- 17.12.2001 Wasserstand: 72 cm
- 25.01.2000 Wasserstand: 72 cm
- 05.02.2012 Wasserstand: 71 cm
- 16.01.2000 Wasserstand: 68 cm
- 12.01.2002 Wasserstand: 65 cm
| Date | Mean value [cm] | Maximum [cm] | Minimum [cm] |
|---|---|---|---|
| 23.05.2023 | 23 | 23 | 23 |
| 22.05.2023 | 24 | 25 | 23 |
| 21.05.2023 | 25 | 26 | 24 |
| 20.05.2023 | 25 | 25 | 25 |
| 19.05.2023 | 25 | 25 | 25 |
| 18.05.2023 | 25 | 25 | 25 |
| 17.05.2023 | 25 | 25 | 24 |
© Bayerisches Landesamt für Umwelt 2024