
- Start >
- Rivers >
- Waterlevel >
- Isar >
- Bad Aibling Willinger Brücke >
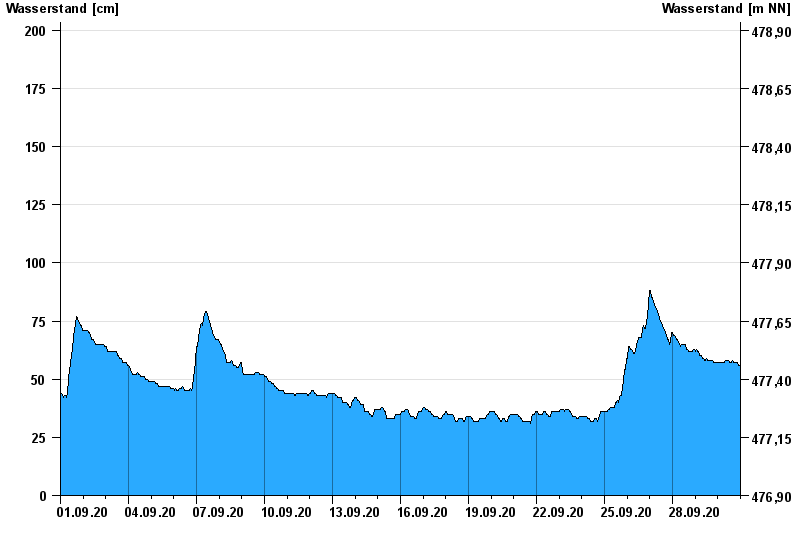
- Chart of month

Chart of month Bad Aibling Willinger Brücke / Mangfall
Waterlevel from 01.09.2020 to 30.09.2020
- Wasserstand: cm
- Wasserstand: cm
- Wasserstand: cm
- Wasserstand: cm
- Wasserstand: cm
| Date | Waterlevel [cm] |
|---|---|
| 01.10.2020 00:45 | 55 |
| 01.10.2020 00:30 | 55 |
| 01.10.2020 00:15 | 55 |
| 01.10.2020 00:00 | 55 |
| 30.09.2020 23:45 | 55 |
| 30.09.2020 23:30 | 55 |
| 30.09.2020 23:15 | 55 |
© Bayerisches Landesamt für Umwelt 2024