
- Start >
- Rivers >
- Waterlevel >
- Isar >
- Bad Aibling >
- Chart of total period

Chart of total period Bad Aibling / Triftbach linker Mühlkanal
Waterlevel from 22.07.1951 to 26.04.2024
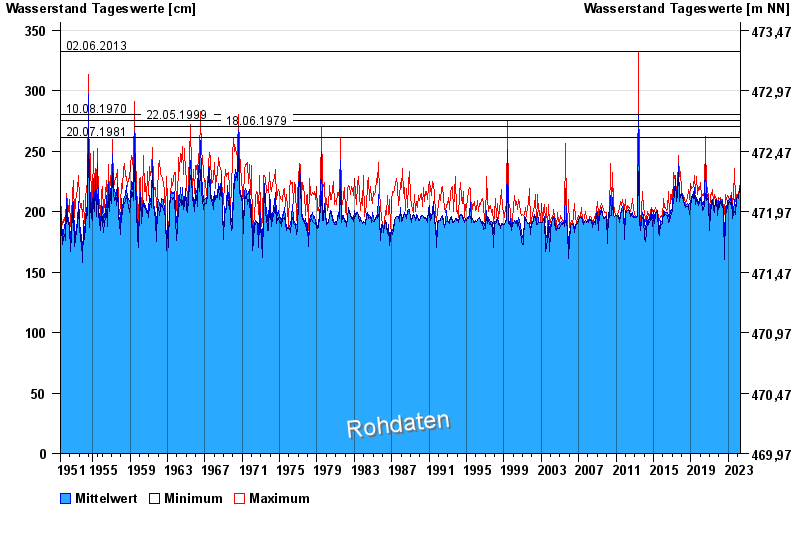
- 02.06.2013 Wasserstand: 332 cm
- 10.08.1970 Wasserstand: 280 cm
- 22.05.1999 Wasserstand: 275 cm
- 18.06.1979 Wasserstand: 270 cm
- 20.07.1981 Wasserstand: 261 cm
| Date | Mean value [cm] | Maximum [cm] | Minimum [cm] |
|---|---|---|---|
| 26.04.2024 | 209 | 210 | 205 |
| 25.04.2024 | 208 | 211 | 200 |
| 24.04.2024 | 210 | 213 | 205 |
| 23.04.2024 | 212 | 214 | 211 |
| 22.04.2024 | 212 | 212 | 212 |
| 21.04.2024 | 212 | 212 | 211 |
| 20.04.2024 | 213 | 216 | 211 |
© Bayerisches Landesamt für Umwelt 2024