
- Start >
- Rivers >
- Waterlevel >
- Isar >
- Bad Aibling >
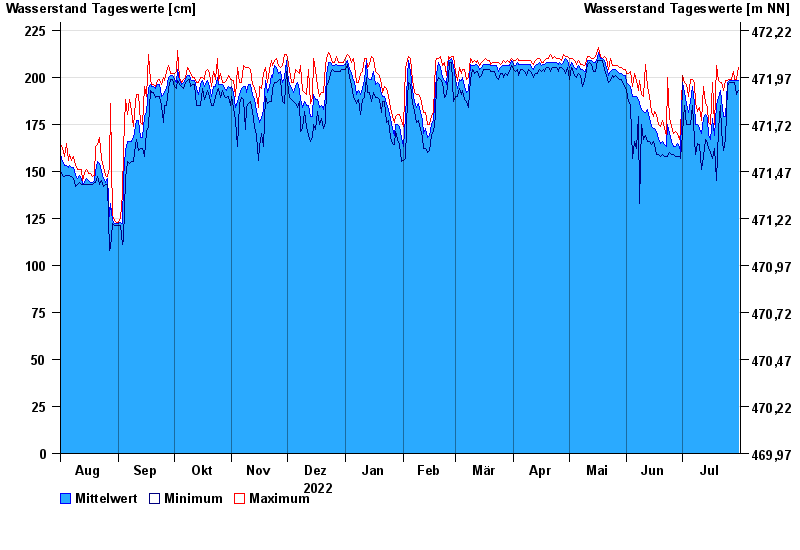
- Chart of year

Chart of year Bad Aibling / Triftbach linker Mühlkanal
Waterlevel from 01.08.2022 to 31.07.2023
- 02.06.2013 Wasserstand: 332 cm
- 10.08.1970 Wasserstand: 280 cm
- 22.05.1999 Wasserstand: 275 cm
- 18.06.1979 Wasserstand: 270 cm
- 20.07.1981 Wasserstand: 261 cm
| Date | Mean value [cm] | Maximum [cm] | Minimum [cm] |
|---|---|---|---|
| 31.07.2023 | 198 | 205 | 193 |
| 30.07.2023 | 198 | 199 | 191 |
| 29.07.2023 | 198 | 199 | 197 |
| 28.07.2023 | 198 | 203 | 197 |
| 27.07.2023 | 198 | 199 | 197 |
| 26.07.2023 | 198 | 199 | 197 |
| 25.07.2023 | 197 | 198 | 195 |
© Bayerisches Landesamt für Umwelt 2024