
- Start >
- Rivers >
- Waterlevel >
- Isar >
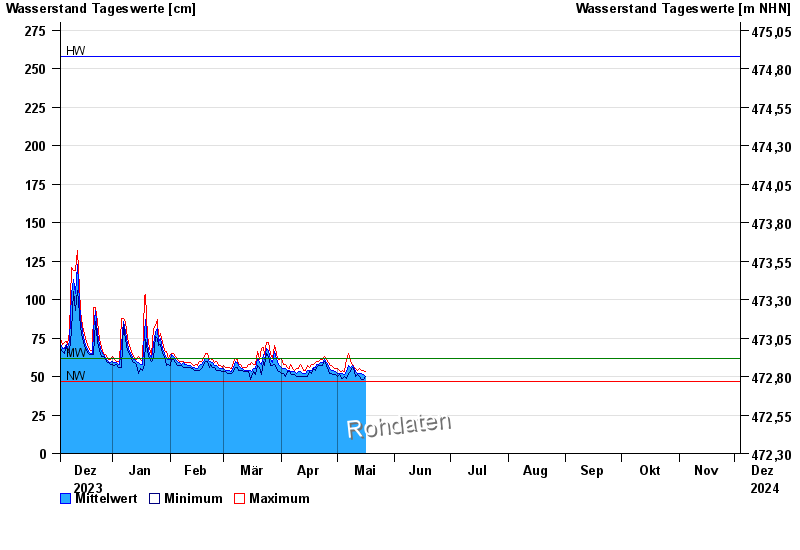
- Bad Aibling >
- Chart of year

Chart of year Bad Aibling / Glonn
Waterlevel from 04.12.2023 to 03.12.2024
| Date | Mean value [cm] | Maximum [cm] | Minimum [cm] |
|---|---|---|---|
| 09.06.2024 | 71 | 73 | 69 |
| 08.06.2024 | 73 | 79 | 69 |
| 07.06.2024 | 81 | 92 | 76 |
| 06.06.2024 | 69 | 77 | 66 |
| 05.06.2024 | 77 | 84 | 71 |
| 04.06.2024 | 98 | 123 | 83 |
| 03.06.2024 | 120 | 138 | 96 |
© Bayerisches Landesamt für Umwelt 2024