
- Start >
- Rivers >
- Waterlevel >
- Isar >
- Bad Aibling >
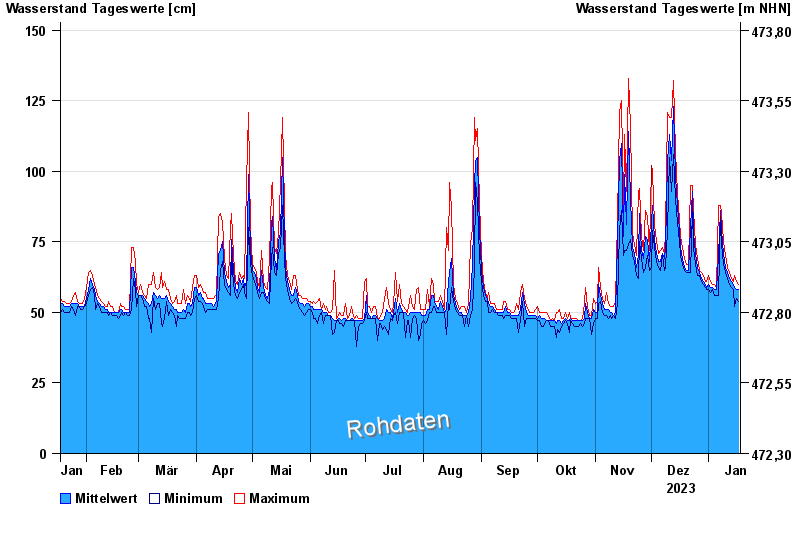
- Chart of year

Chart of year Bad Aibling / Glonn
Waterlevel from 18.01.2023 to 17.01.2024
- 31.05.1940 Wasserstand: 315 cm
- 09.07.1954 Wasserstand: 297 cm
- 04.08.2020 Wasserstand: 258 cm
- 03.06.2013 Wasserstand: 252 cm
- 22.05.1999 Wasserstand: 243 cm
| Date | Mean value [cm] | Maximum [cm] | Minimum [cm] |
|---|---|---|---|
| 17.01.2024 | 58 | 60 | 54 |
| 16.01.2024 | 58 | 61 | 55 |
| 15.01.2024 | 59 | 63 | 52 |
| 14.01.2024 | 60 | 61 | 58 |
| 13.01.2024 | 61 | 62 | 59 |
| 12.01.2024 | 62 | 64 | 60 |
| 11.01.2024 | 64 | 66 | 62 |
© Bayerisches Landesamt für Umwelt 2024