
- Start >
- Rivers >
- Waterlevel >
- Isar >
- Ampermoching >
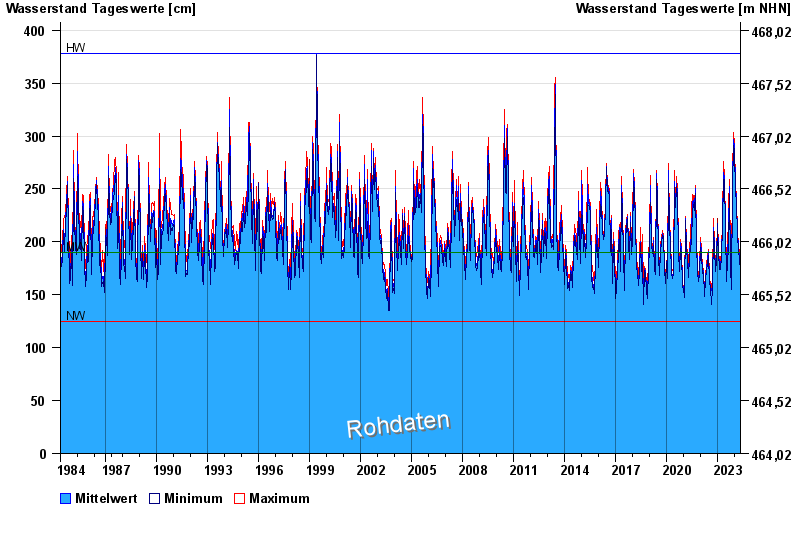
- Chart of total period

Chart of total period Ampermoching / Amper
Waterlevel from 30.04.1984 to 01.05.2024
| Date | Mean value [cm] | Maximum [cm] | Minimum [cm] |
|---|---|---|---|
| 01.05.2024 | 173 | 174 | 171 |
| 30.04.2024 | 172 | 174 | 168 |
| 29.04.2024 | 172 | 174 | 169 |
| 28.04.2024 | 172 | 178 | 166 |
| 27.04.2024 | 173 | 174 | 172 |
| 26.04.2024 | 175 | 176 | 173 |
| 25.04.2024 | 176 | 178 | 173 |
© Bayerisches Landesamt für Umwelt 2024