
- Start >
- Rivers >
- Waterlevel >
- Inn >
- Walchen >
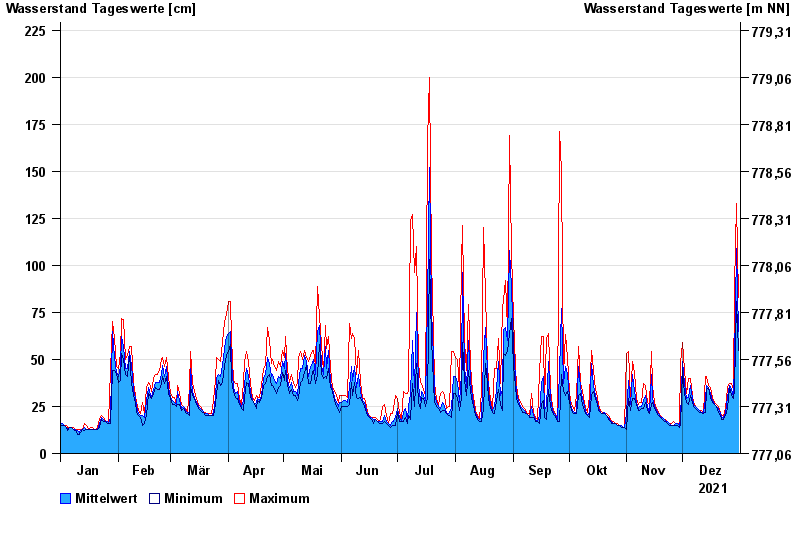
- Chart of year

Chart of year Walchen / Walchen
Waterlevel from 01.01.2021 to 31.12.2021
- 23.08.2005 Wasserstand: 432 cm
- 22.05.1999 Wasserstand: 416 cm
- 02.06.2013 Wasserstand: 384 cm
- 03.06.2010 Wasserstand: 343 cm
- 12.08.2002 Wasserstand: 338 cm
| Date | Mean value [cm] | Maximum [cm] | Minimum [cm] |
|---|---|---|---|
| 31.12.2021 | 65 | 83 | 55 |
| 30.12.2021 | 109 | 133 | 81 |
| 29.12.2021 | 49 | 88 | 34 |
| 28.12.2021 | 30 | 34 | 29 |
| 27.12.2021 | 34 | 37 | 31 |
| 26.12.2021 | 36 | 37 | 35 |
| 25.12.2021 | 30 | 35 | 24 |
© Bayerisches Landesamt für Umwelt 2024