
- Start >
- Rivers >
- Waterlevel >
- Inn >
- Triftern >
- Chart of total period

Chart of total period Triftern / Altbach
Waterlevel from 01.11.1983 to 30.04.2024
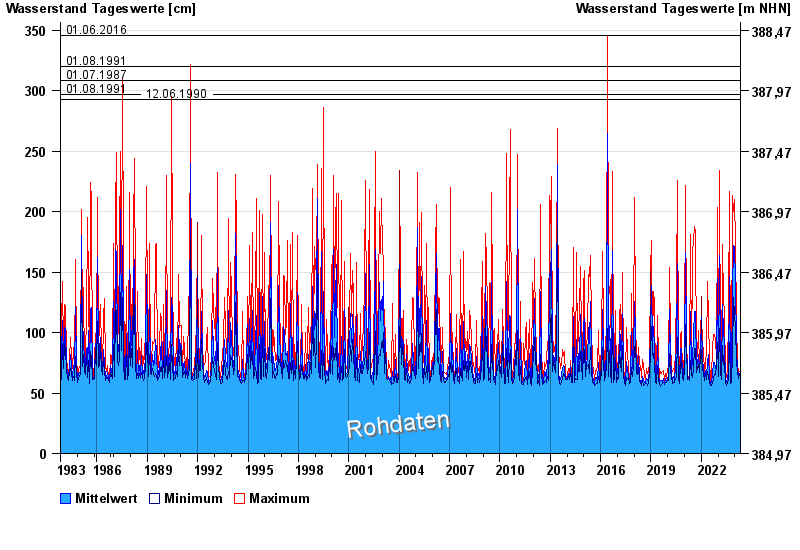
- 01.06.2016 Wasserstand: 346 cm
- 01.08.1991 Wasserstand: 320 cm
- 01.07.1987 Wasserstand: 308 cm
- 01.08.1991 Wasserstand: 297 cm
- 12.06.1990 Wasserstand: 293 cm
| Date | Mean value [cm] | Maximum [cm] | Minimum [cm] |
|---|---|---|---|
| 30.04.2024 | 60 | 60 | 59 |
| 29.04.2024 | 60 | 60 | 60 |
| 28.04.2024 | 60 | 61 | 60 |
| 27.04.2024 | 61 | 61 | 60 |
| 26.04.2024 | 62 | 63 | 61 |
| 25.04.2024 | 64 | 65 | 63 |
| 24.04.2024 | 63 | 65 | 62 |
© Bayerisches Landesamt für Umwelt 2024