
- Start >
- Rivers >
- Waterlevel >
- Inn >
- Schmerold >
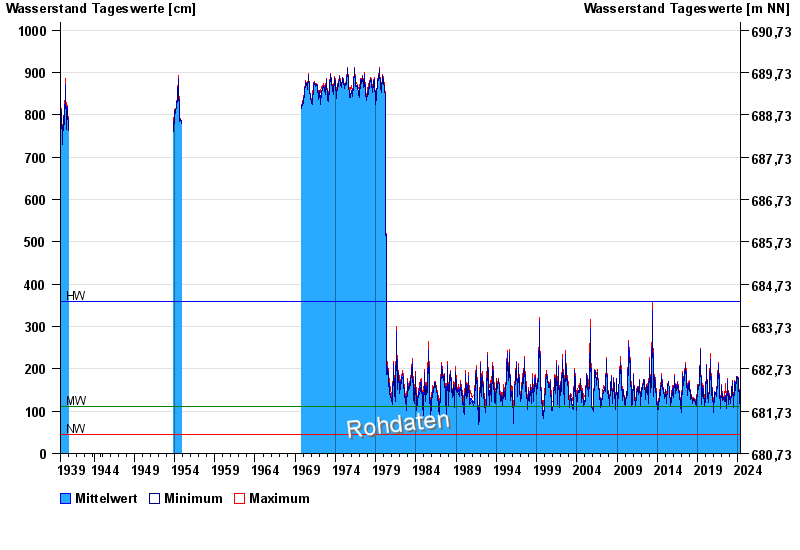
- Chart of total period

Chart of total period Schmerold / Mangfall
Waterlevel from 30.10.1939 to 06.05.2024
| Date | Mean value [cm] | Maximum [cm] | Minimum [cm] |
|---|---|---|---|
| 06.05.2024 | 119 | 121 | 117 |
| 05.05.2024 | 123 | 126 | 120 |
| 04.05.2024 | 127 | 129 | 125 |
| 03.05.2024 | 131 | 134 | 128 |
| 02.05.2024 | 138 | 149 | 133 |
| 01.05.2024 | 144 | 146 | 142 |
| 30.04.2024 | 145 | 147 | 144 |
© Bayerisches Landesamt für Umwelt 2024