
- Start >
- Rivers >
- Waterlevel >
- Inn >
- Rosenheim o.d. Mangfallmündung >
- Chart of total period

Chart of total period Rosenheim o.d. Mangfallmündung / Inn
Waterlevel from 26.01.1970 to 01.05.2024
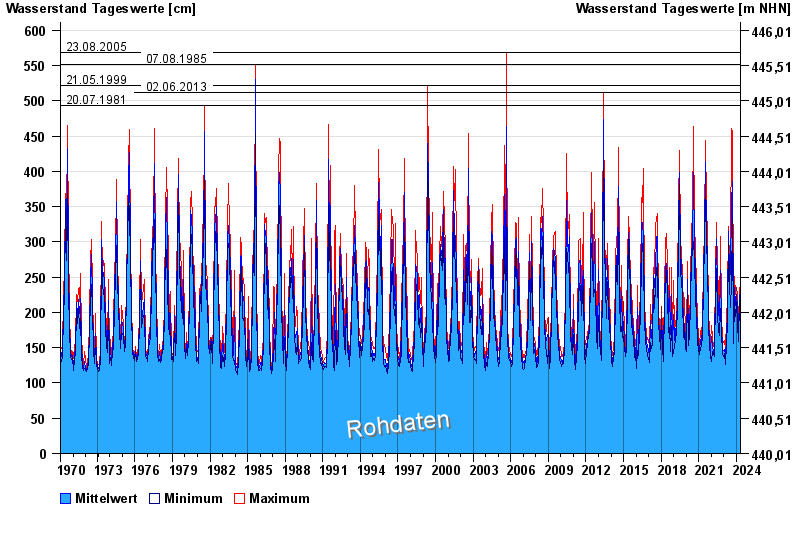
- 23.08.2005 Wasserstand: 568 cm
- 07.08.1985 Wasserstand: 551 cm
- 21.05.1999 Wasserstand: 522 cm
- 02.06.2013 Wasserstand: 511 cm
- 20.07.1981 Wasserstand: 493 cm
| Date | Mean value [cm] | Maximum [cm] | Minimum [cm] |
|---|---|---|---|
| 01.05.2024 | 172 | 181 | 164 |
| 30.04.2024 | 171 | 182 | 165 |
| 29.04.2024 | 157 | 168 | 151 |
| 28.04.2024 | 155 | 170 | 142 |
| 27.04.2024 | 156 | 161 | 153 |
| 26.04.2024 | 147 | 154 | 138 |
| 25.04.2024 | 154 | 161 | 149 |
© Bayerisches Landesamt für Umwelt 2024