
- Start >
- Rivers >
- Waterlevel >
- Inn >
- Oberding >
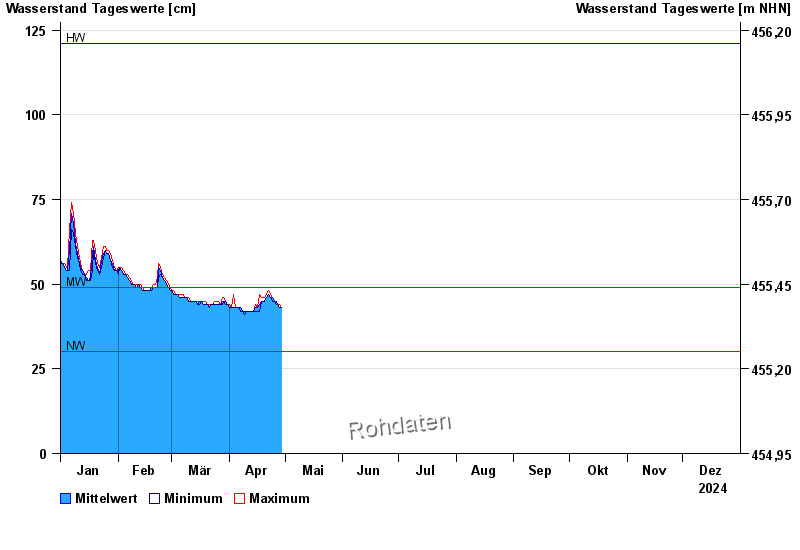
- Chart of year

Chart of year Oberding / Gfällach
Waterlevel from 01.01.2024 to 31.12.2024
| Date | Mean value [cm] | Maximum [cm] | Minimum [cm] |
|---|---|---|---|
| 03.06.2024 | 83 | 84 | 81 |
| 02.06.2024 | 91 | 96 | 84 |
| 01.06.2024 | 87 | 98 | 68 |
| 31.05.2024 | 61 | 68 | 51 |
| 30.05.2024 | 51 | 52 | 51 |
| 29.05.2024 | 53 | 54 | 51 |
| 28.05.2024 | 56 | 57 | 49 |
© Bayerisches Landesamt für Umwelt 2024