
- Start >
- Rivers >
- Waterlevel >
- Inn >
- München >
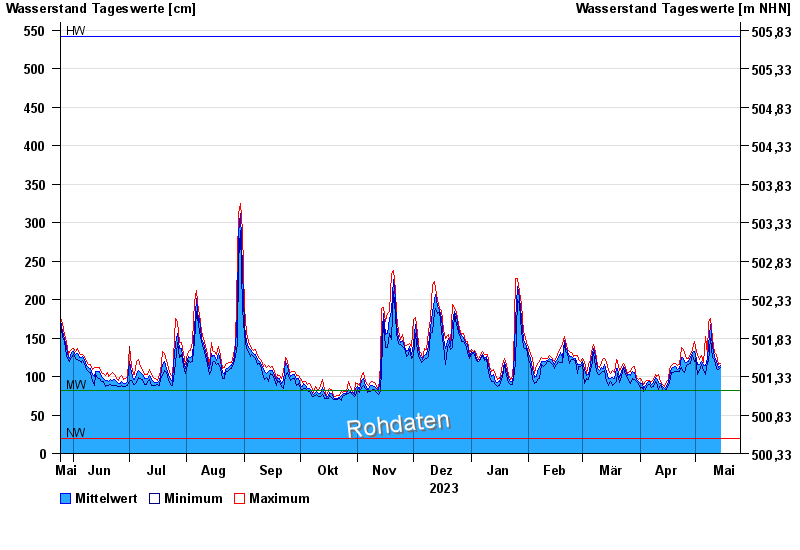
- Chart of year

Chart of year München / Isar
Waterlevel from 25.05.2023 to 24.05.2024
| Date | Mean value [cm] | Maximum [cm] | Minimum [cm] |
|---|---|---|---|
| 14.05.2024 | 113 | 117 | 109 |
| 13.05.2024 | 112 | 116 | 109 |
| 12.05.2024 | 120 | 128 | 111 |
| 11.05.2024 | 126 | 131 | 122 |
| 10.05.2024 | 139 | 150 | 125 |
| 09.05.2024 | 167 | 175 | 150 |
| 08.05.2024 | 140 | 171 | 119 |
© Bayerisches Landesamt für Umwelt 2024