
- Start >
- Rivers >
- Waterlevel >
- Inn >
- Mühlau >
- Chart of total period

Chart of total period Mühlau / Mühlbach
Waterlevel from 16.06.2007 to 26.04.2024
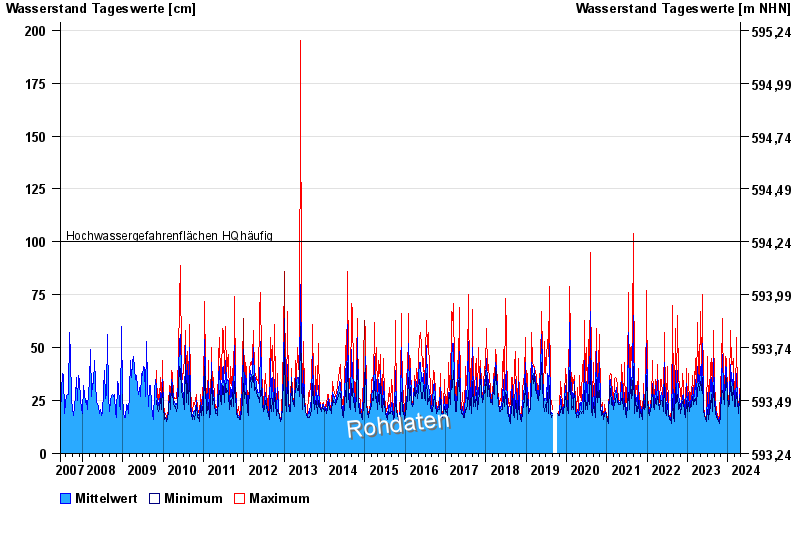
- Hochwassergefahrenfläche HQhäufig 100 cm
| Date | Mean value [cm] | Maximum [cm] | Minimum [cm] |
|---|---|---|---|
| 26.04.2024 | 23 | 24 | 23 |
| 25.04.2024 | 23 | 24 | 22 |
| 24.04.2024 | 23 | 23 | 22 |
| 23.04.2024 | 23 | 25 | 21 |
| 22.04.2024 | 25 | 27 | 24 |
| 21.04.2024 | 26 | 28 | 25 |
| 20.04.2024 | 28 | 30 | 26 |
© Bayerisches Landesamt für Umwelt 2024