
- Start >
- Rivers >
- Waterlevel >
- Inn >
- Kirchberg >
- Chart of total period

Chart of total period Kirchberg / Mertseebach
Waterlevel from 01.11.1985 to 03.05.2024
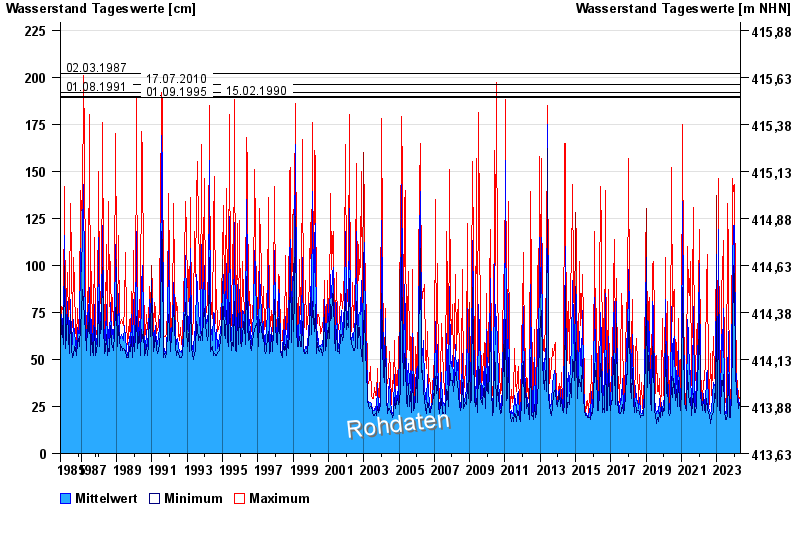
- 02.03.1987 Wasserstand: 202 cm
- 17.07.2010 Wasserstand: 196 cm
- 01.08.1991 Wasserstand: 192 cm
- 15.02.1990 Wasserstand: 190 cm
- 01.09.1995 Wasserstand: 189 cm
| Date | Mean value [cm] | Maximum [cm] | Minimum [cm] |
|---|---|---|---|
| 03.05.2024 | 24 | 24 | 23 |
| 02.05.2024 | 24 | 24 | 24 |
| 01.05.2024 | 24 | 25 | 24 |
| 30.04.2024 | 24 | 25 | 24 |
| 29.04.2024 | 24 | 25 | 24 |
| 28.04.2024 | 25 | 25 | 24 |
| 27.04.2024 | 25 | 25 | 25 |
© Bayerisches Landesamt für Umwelt 2024