
- Start >
- Rivers >
- Waterlevel >
- Inn >
- Eschelbach >
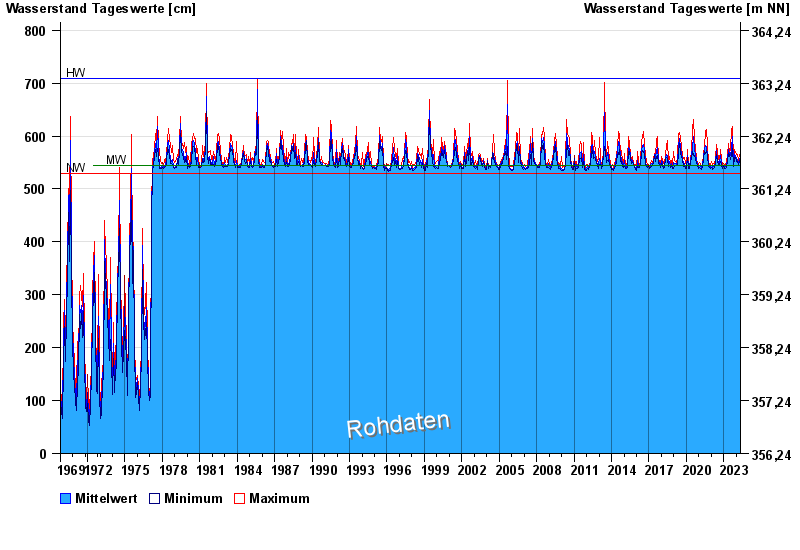
- Chart of total period

Chart of total period Eschelbach / Inn
Waterlevel from 01.11.1969 to 02.05.2024
| Date | Mean value [cm] | Maximum [cm] | Minimum [cm] |
|---|---|---|---|
| 02.05.2024 | 494 | 549 | 228 |
| 01.05.2024 | 547 | 554 | 540 |
| 30.04.2024 | 546 | 551 | 543 |
| 29.04.2024 | 544 | 548 | 539 |
| 28.04.2024 | 544 | 548 | 538 |
| 27.04.2024 | 543 | 545 | 541 |
| 26.04.2024 | 541 | 545 | 538 |
© Bayerisches Landesamt für Umwelt 2024