
- Start >
- Rivers >
- Waterlevel >
- Inn >
- Bad Wiessee >
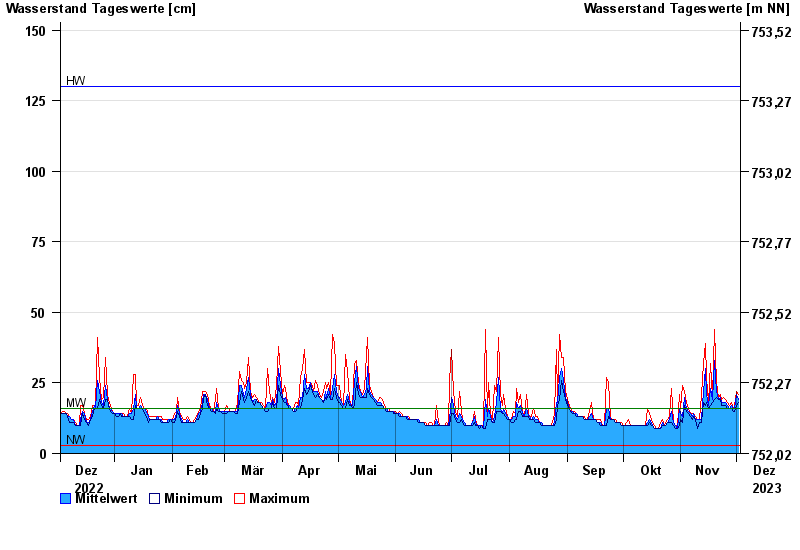
- Chart of year

Chart of year Bad Wiessee / Zeiselbach
Waterlevel from 03.12.2022 to 02.12.2023
| Date | Mean value [cm] | Maximum [cm] | Minimum [cm] |
|---|---|---|---|
| 02.12.2023 | 19 | 21 | 18 |
| 01.12.2023 | 21 | 22 | 17 |
| 30.11.2023 | 16 | 17 | 15 |
| 29.11.2023 | 16 | 16 | 15 |
| 28.11.2023 | 17 | 18 | 16 |
| 27.11.2023 | 16 | 17 | 16 |
| 26.11.2023 | 17 | 18 | 16 |
© Bayerisches Landesamt für Umwelt 2024