
- Start >
- Rivers >
- Waterlevel >
- Inn >
- Bad Tölz Brücke >
- Chart of total period

Chart of total period Bad Tölz Brücke / Isar
Waterlevel from 01.11.1969 to 01.05.2024
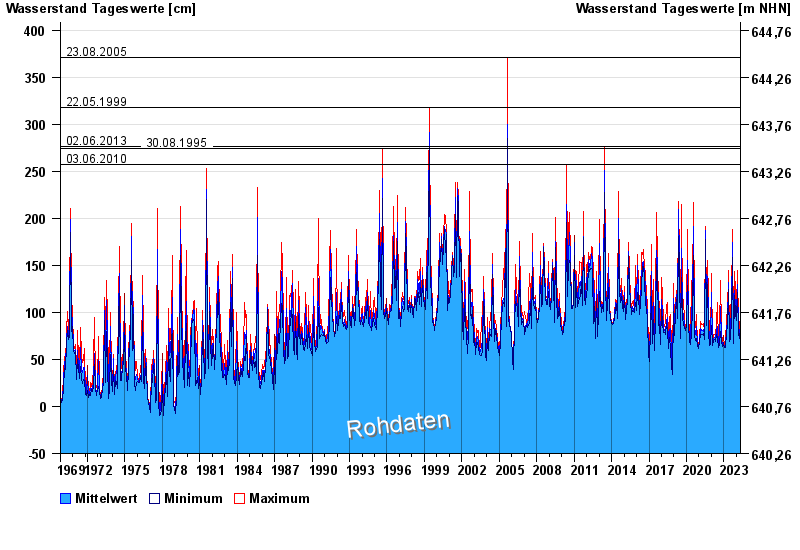
- 23.08.2005 Wasserstand: 371 cm
- 22.05.1999 Wasserstand: 318 cm
- 02.06.2013 Wasserstand: 276 cm
- 30.08.1995 Wasserstand: 274 cm
- 03.06.2010 Wasserstand: 257 cm
| Date | Mean value [cm] | Maximum [cm] | Minimum [cm] |
|---|---|---|---|
| 01.05.2024 | 80 | 84 | 78 |
| 30.04.2024 | 90 | 107 | 84 |
| 29.04.2024 | 88 | 93 | 84 |
| 28.04.2024 | 87 | 93 | 82 |
| 27.04.2024 | 78 | 87 | 75 |
| 26.04.2024 | 74 | 76 | 73 |
| 25.04.2024 | 73 | 74 | 72 |
© Bayerisches Landesamt für Umwelt 2024