
- Start >
- Rivers >
- Waterlevel >
- Inn >
- Bad Feilnbach >
- Chart of total period

Chart of total period Bad Feilnbach / Jenbach
Waterlevel from 01.11.1975 to 03.05.2024
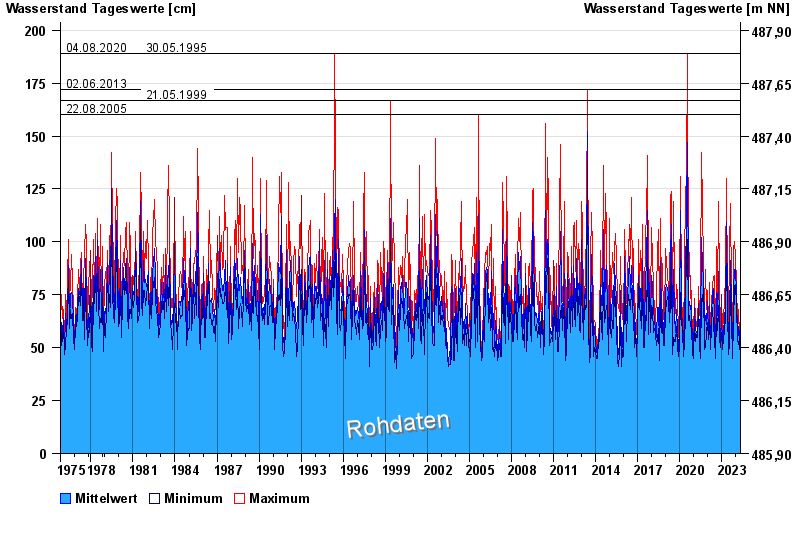
- 04.08.2020 Wasserstand: 189 cm
- 30.05.1995 Wasserstand: 189 cm
- 02.06.2013 Wasserstand: 172 cm
- 21.05.1999 Wasserstand: 167 cm
- 22.08.2005 Wasserstand: 160 cm
| Date | Mean value [cm] | Maximum [cm] | Minimum [cm] |
|---|---|---|---|
| 03.05.2024 | 52 | 55 | 49 |
| 02.05.2024 | 55 | 57 | 52 |
| 01.05.2024 | 58 | 61 | 56 |
| 30.04.2024 | 62 | 67 | 60 |
| 29.04.2024 | 65 | 68 | 60 |
| 28.04.2024 | 65 | 70 | 60 |
| 27.04.2024 | 57 | 66 | 51 |
© Bayerisches Landesamt für Umwelt 2024