
- Start >
- Rivers >
- Waterlevel >
- Inn >
- Bad Aibling Willinger Brücke >
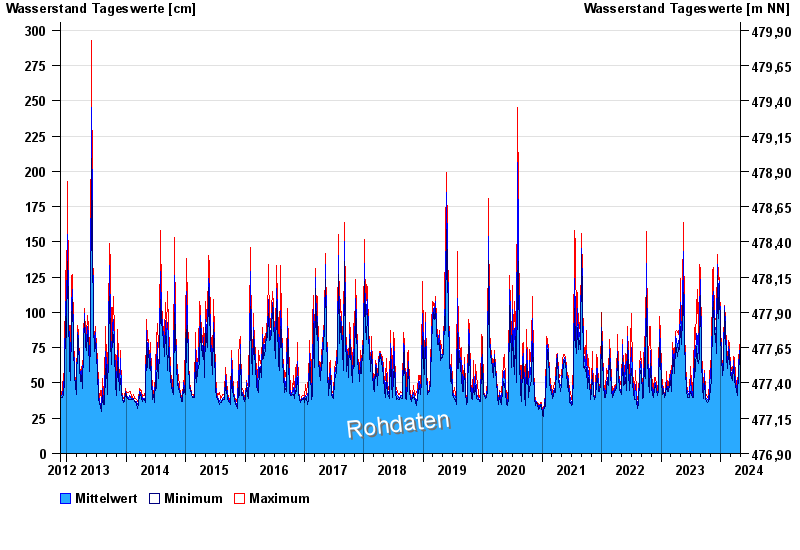
- Chart of total period

Chart of total period Bad Aibling Willinger Brücke / Mangfall
Waterlevel from 23.11.2012 to 02.05.2024
 Für diesen Pegel sind keine Meldestufen hinterlegt.
| Date | Mean value [cm] | Maximum [cm] | Minimum [cm] |
|---|---|---|---|
| 02.05.2024 | 69 | 72 | 64 |
| 01.05.2024 | 73 | 75 | 68 |
| 30.04.2024 | 73 | 75 | 72 |
| 29.04.2024 | 73 | 77 | 68 |
| 28.04.2024 | 67 | 74 | 63 |
| 27.04.2024 | 57 | 63 | 55 |
| 26.04.2024 | 56 | 57 | 55 |
© Bayerisches Landesamt für Umwelt 2024