
- Start >
- Rivers >
- Waterlevel >
- Inn >
- Bad Aibling >
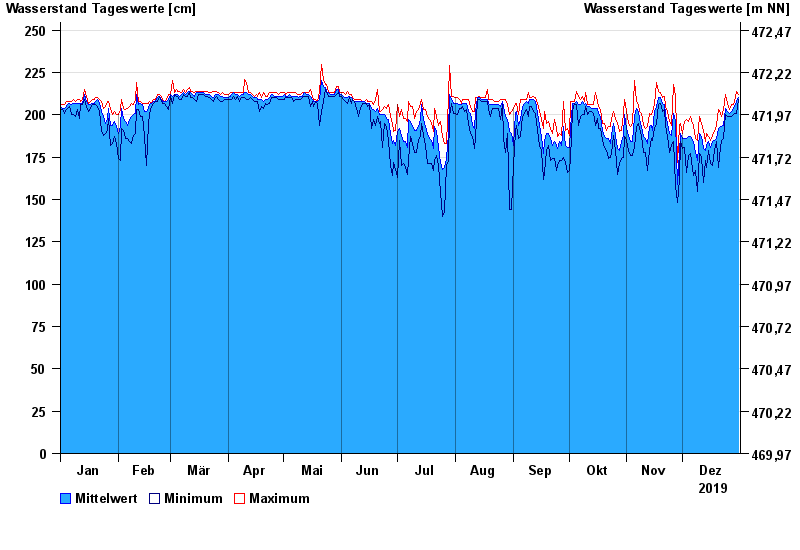
- Chart of year

Chart of year Bad Aibling / Triftbach linker Mühlkanal
Waterlevel from 01.01.2019 to 31.12.2019
 Für diesen Pegel sind keine Hochwassermarken hinterlegt.
| Date | Mean value [cm] | Maximum [cm] | Minimum [cm] |
|---|---|---|---|
| 31.12.2019 | 210 | 212 | 209 |
| 30.12.2019 | 208 | 214 | 201 |
| 29.12.2019 | 205 | 208 | 201 |
| 28.12.2019 | 204 | 206 | 200 |
| 27.12.2019 | 202 | 206 | 199 |
| 26.12.2019 | 201 | 203 | 199 |
| 25.12.2019 | 202 | 207 | 199 |
© Bayerisches Landesamt für Umwelt 2024