
- Start >
- Rivers >
- Waterlevel >
- Iller - Lech - Bodensee >
- Wiblingen >
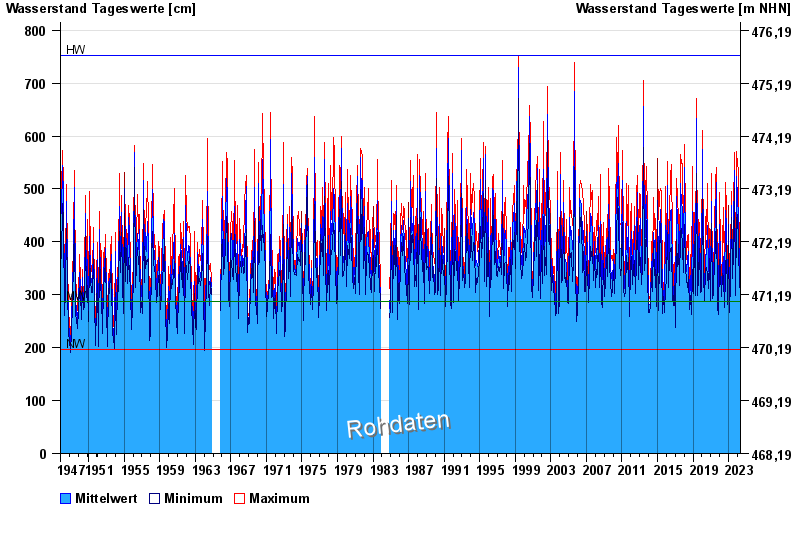
- Chart of total period

Chart of total period Wiblingen / Iller
Waterlevel from 01.11.1947 to 02.05.2024
| Date | Mean value [cm] | Maximum [cm] | Minimum [cm] |
|---|---|---|---|
| 02.05.2024 | 322 | 328 | 319 |
| 01.05.2024 | 332 | 338 | 325 |
| 30.04.2024 | 332 | 342 | 322 |
| 29.04.2024 | 329 | 337 | 312 |
| 28.04.2024 | 314 | 338 | 290 |
| 27.04.2024 | 296 | 303 | 285 |
| 26.04.2024 | 291 | 294 | 284 |
© Bayerisches Landesamt für Umwelt 2024