
- Start >
- Rivers >
- Waterlevel >
- Iller - Lech - Bodensee >
- Tiefenbach >
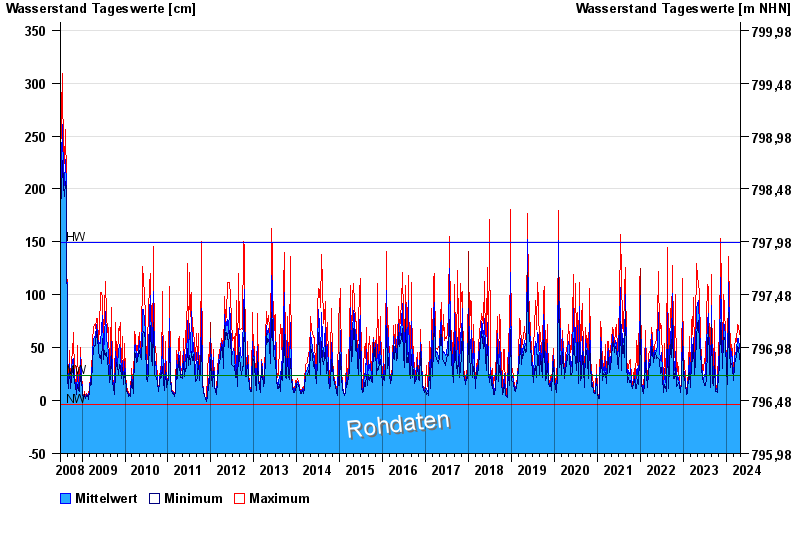
- Chart of total period

Chart of total period Tiefenbach / Breitach
Waterlevel from 01.07.2008 to 02.05.2024
| Date | Mean value [cm] | Maximum [cm] | Minimum [cm] |
|---|---|---|---|
| 02.05.2024 | 59 | 60 | 58 |
| 01.05.2024 | 56 | 65 | 48 |
| 30.04.2024 | 57 | 67 | 48 |
| 29.04.2024 | 53 | 67 | 40 |
| 28.04.2024 | 49 | 62 | 39 |
| 27.04.2024 | 34 | 48 | 24 |
| 26.04.2024 | 23 | 30 | 18 |
© Bayerisches Landesamt für Umwelt 2024