
- Start >
- Rivers >
- Waterlevel >
- Iller - Lech - Bodensee >
- Thalhofen >
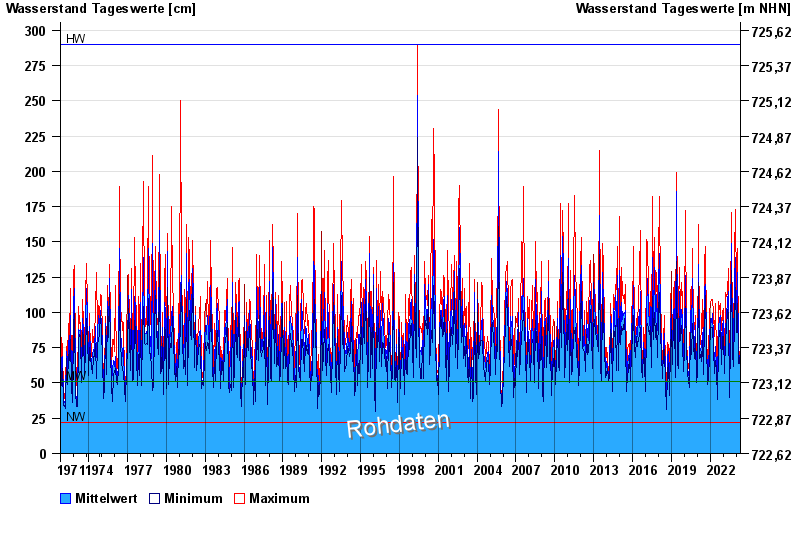
- Chart of total period

Chart of total period Thalhofen / Wertach
Waterlevel from 01.11.1971 to 01.05.2024
| Date | Mean value [cm] | Maximum [cm] | Minimum [cm] |
|---|---|---|---|
| 01.05.2024 | 74 | 75 | 74 |
| 30.04.2024 | 65 | 75 | 62 |
| 29.04.2024 | 64 | 66 | 62 |
| 28.04.2024 | 66 | 67 | 64 |
| 27.04.2024 | 67 | 70 | 66 |
| 26.04.2024 | 69 | 72 | 67 |
| 25.04.2024 | 70 | 72 | 69 |
© Bayerisches Landesamt für Umwelt 2024