
- Start >
- Rivers >
- Waterlevel >
- Iller - Lech - Bodensee >
- Stielings >
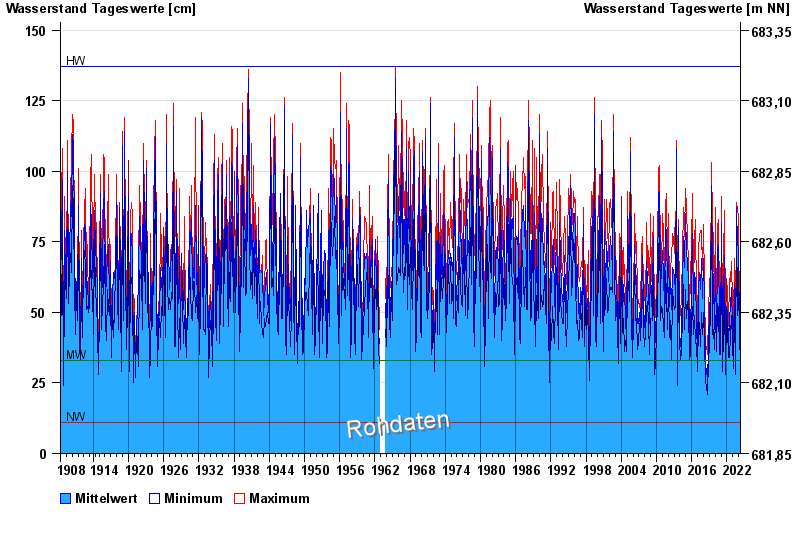
- Chart of total period

Chart of total period Stielings / Leubas
Waterlevel from 01.06.1908 to 27.04.2024
| Date | Mean value [cm] | Maximum [cm] | Minimum [cm] |
|---|---|---|---|
| 27.04.2024 | 34 | 36 | 33 |
| 26.04.2024 | 35 | 38 | 34 |
| 25.04.2024 | 37 | 40 | 35 |
| 24.04.2024 | 36 | 39 | 31 |
| 23.04.2024 | 37 | 40 | 36 |
| 22.04.2024 | 41 | 47 | 37 |
| 21.04.2024 | 45 | 50 | 41 |
© Bayerisches Landesamt für Umwelt 2024