
- Start >
- Rivers >
- Waterlevel >
- Iller - Lech - Bodensee >
- Schöllang >
- Chart of year

Chart of year Schöllang / Eybach
Waterlevel from 29.03.2024 to 28.03.2025
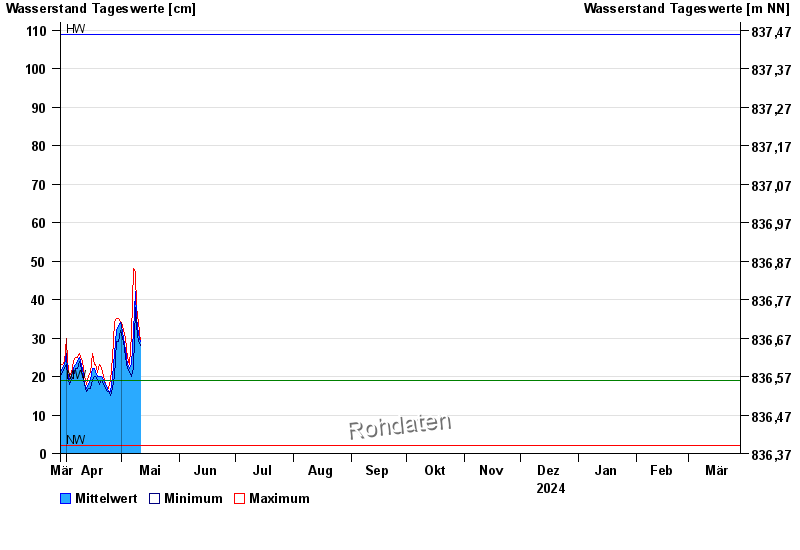
| Date | Mean value [cm] | Maximum [cm] | Minimum [cm] |
|---|---|---|---|
| 28.04.2024 | 30 | 31 | 29 |
| 27.04.2024 | 26 | 34 | 20 |
| 26.04.2024 | 20 | 25 | 17 |
| 25.04.2024 | 16 | 19 | 15 |
| 24.04.2024 | 16 | 17 | 16 |
| 23.04.2024 | 17 | 17 | 16 |
| 22.04.2024 | 18 | 18 | 17 |
© Bayerisches Landesamt für Umwelt 2024