
- Start >
- Rivers >
- Waterlevel >
- Iller - Lech - Bodensee >
- Schöllang >
- Chart of total period

Chart of total period Schöllang / Eybach
Waterlevel from 31.10.1977 to 26.04.2024
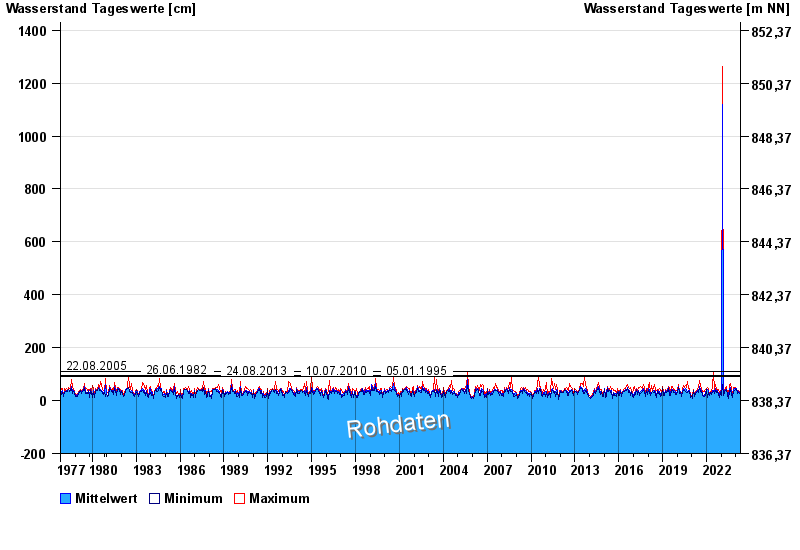
- 22.08.2005 Wasserstand: 109 cm
- 26.06.1982 Wasserstand: 94 cm
- 24.08.2013 Wasserstand: 91 cm
- 10.07.2010 Wasserstand: 90 cm
- 05.01.1995 Wasserstand: 90 cm
| Date | Mean value [cm] | Maximum [cm] | Minimum [cm] |
|---|---|---|---|
| 26.04.2024 | 18 | 21 | 17 |
| 25.04.2024 | 16 | 19 | 15 |
| 24.04.2024 | 16 | 17 | 16 |
| 23.04.2024 | 17 | 17 | 16 |
| 22.04.2024 | 18 | 18 | 17 |
| 21.04.2024 | 19 | 20 | 18 |
| 20.04.2024 | 20 | 22 | 19 |
© Bayerisches Landesamt für Umwelt 2024