
- Start >
- Rivers >
- Waterlevel >
- Iller - Lech - Bodensee >
- Schlehdorf >
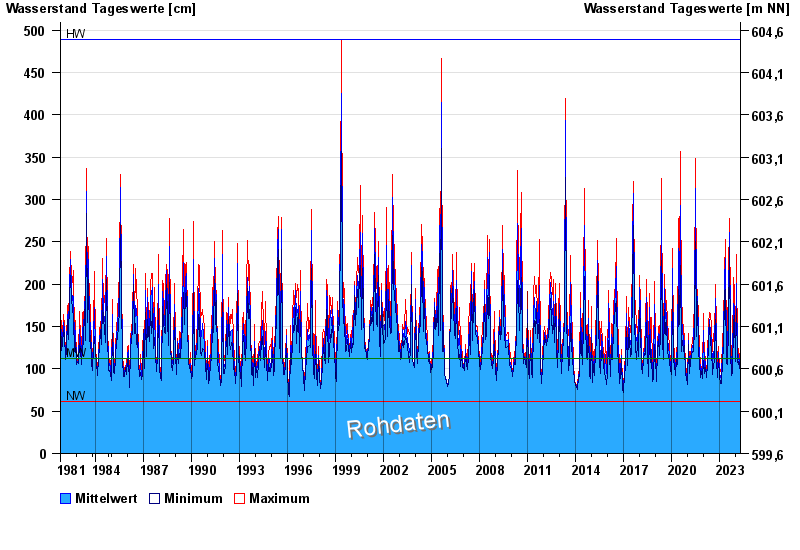
- Chart of total period

Chart of total period Schlehdorf / Loisach
Waterlevel from 01.11.1981 to 01.05.2024
| Date | Mean value [cm] | Maximum [cm] | Minimum [cm] |
|---|---|---|---|
| 01.05.2024 | 115 | 121 | 110 |
| 30.04.2024 | 119 | 127 | 114 |
| 29.04.2024 | 122 | 131 | 114 |
| 28.04.2024 | 117 | 130 | 112 |
| 27.04.2024 | 104 | 118 | 101 |
| 26.04.2024 | 98 | 101 | 96 |
| 25.04.2024 | 100 | 101 | 98 |
© Bayerisches Landesamt für Umwelt 2024