
- Start >
- Rivers >
- Waterlevel >
- Iller - Lech - Bodensee >
- Rosenheim o.d. Mangfallmündung >
- Chart of total period

Chart of total period Rosenheim o.d. Mangfallmündung / Inn
Waterlevel from 26.01.1970 to 26.04.2024
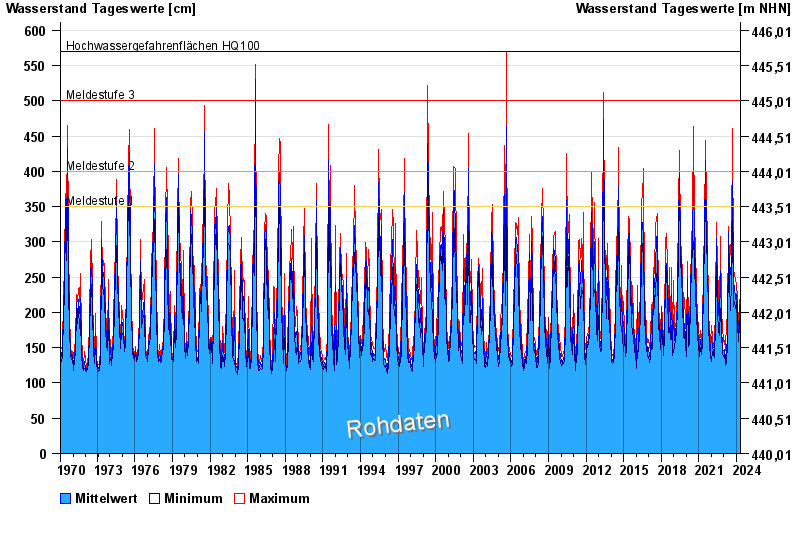
- Meldestufe 1 350 cm
- Meldestufe 2 400 cm
- Meldestufe 3 500 cm
- Hochwassergefahrenfläche HQ100 570 cm
| Date | Mean value [cm] | Maximum [cm] | Minimum [cm] |
|---|---|---|---|
| 26.04.2024 | 146 | 150 | 138 |
| 25.04.2024 | 154 | 161 | 149 |
| 24.04.2024 | 160 | 169 | 153 |
| 23.04.2024 | 166 | 176 | 160 |
| 22.04.2024 | 161 | 173 | 154 |
| 21.04.2024 | 162 | 173 | 152 |
| 20.04.2024 | 173 | 179 | 167 |
© Bayerisches Landesamt für Umwelt 2024