
- Start >
- Rivers >
- Waterlevel >
- Iller - Lech - Bodensee >
- Pfaffenhofen >
- Chart of year

Chart of year Pfaffenhofen / Zusam
Waterlevel from 01.01.2024 to 07.05.2024
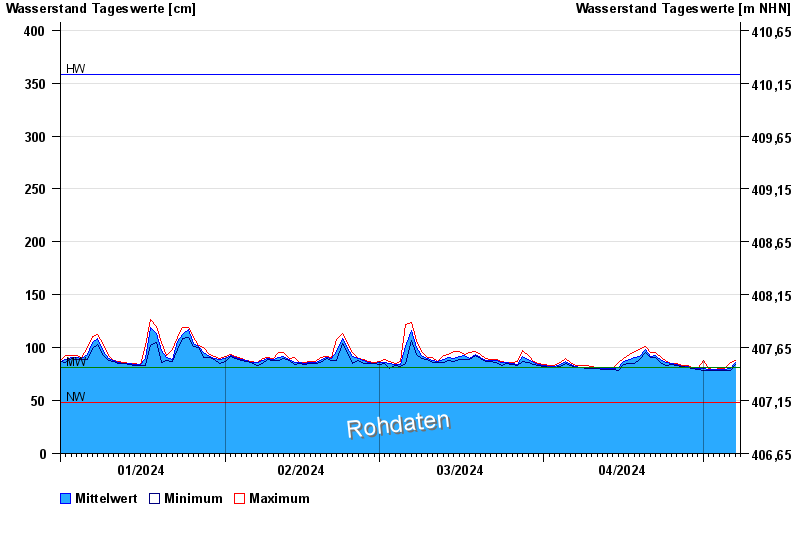
| Date | Mean value [cm] | Maximum [cm] | Minimum [cm] |
|---|---|---|---|
| 07.05.2024 | 86 | 88 | 85 |
| 06.05.2024 | 80 | 86 | 78 |
| 05.05.2024 | 79 | 80 | 78 |
| 04.05.2024 | 79 | 80 | 78 |
| 03.05.2024 | 79 | 79 | 78 |
| 02.05.2024 | 79 | 80 | 78 |
| 01.05.2024 | 80 | 88 | 78 |
© Bayerisches Landesamt für Umwelt 2024