
- Start >
- Rivers >
- Waterlevel >
- Iller - Lech - Bodensee >
- Oberstaufen >
- Chart of total period

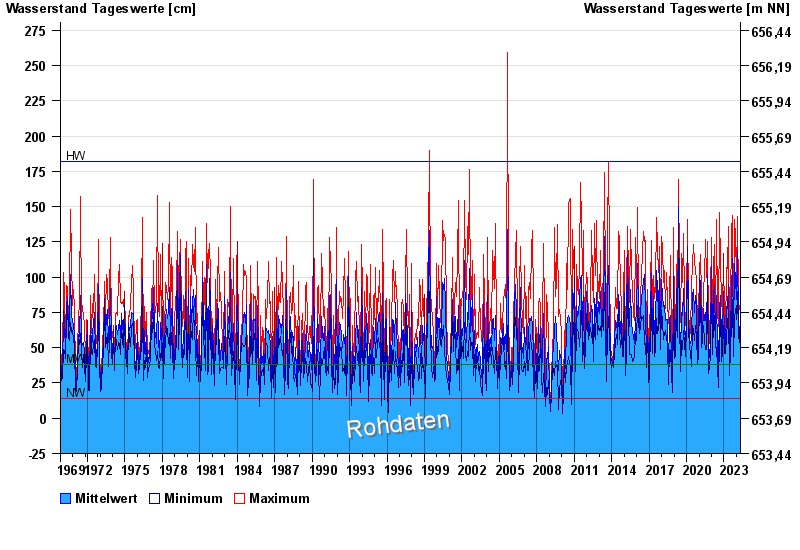
Chart of total period Oberstaufen / Weißach
Waterlevel from 01.11.1969 to 28.04.2024
| Date | Mean value [cm] | Maximum [cm] | Minimum [cm] |
|---|---|---|---|
| 28.04.2024 | 66 | 68 | 65 |
| 27.04.2024 | 57 | 71 | 48 |
| 26.04.2024 | 43 | 56 | 38 |
| 25.04.2024 | 38 | 40 | 37 |
| 24.04.2024 | 37 | 38 | 36 |
| 23.04.2024 | 38 | 39 | 37 |
| 22.04.2024 | 40 | 42 | 39 |
© Bayerisches Landesamt für Umwelt 2024