
- Start >
- Rivers >
- Waterlevel >
- Iller - Lech - Bodensee >
- Lechbruck >
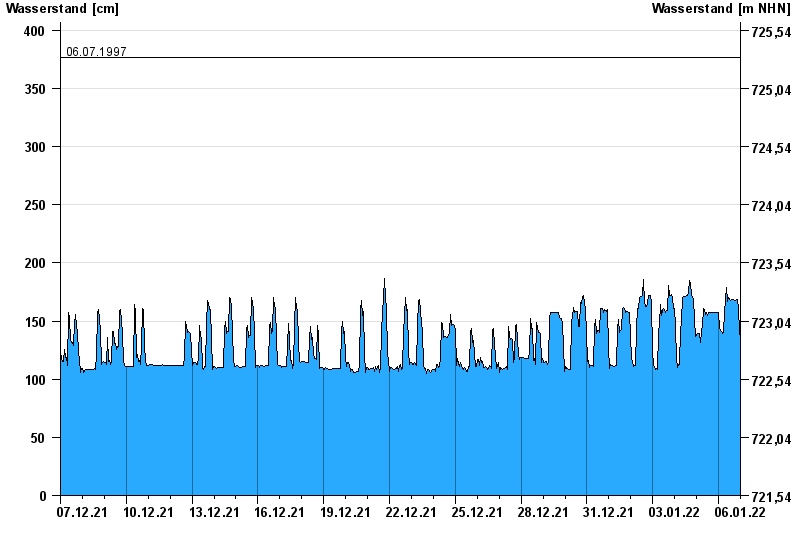
- Chart of month

Chart of month Lechbruck / Lech
Waterlevel from 07.12.2021 to 06.01.2022
note
Messwerte beeinflusst durch Kraftwerkssteuerungen.
- 22.05.1999 Wasserstand: 457 cm
- 23.08.2005 Wasserstand: 455 cm
- 10.08.1970 Wasserstand: 448 cm
- 13.05.1999 Wasserstand: 419 cm
- 06.07.1997 Wasserstand: 377 cm
| Date | Waterlevel [cm] |
|---|---|
| 06.01.2022 23:45 | 135 |
| 06.01.2022 23:30 | 131 |
| 06.01.2022 23:15 | 125 |
| 06.01.2022 23:00 | 125 |
| 06.01.2022 22:45 | 130 |
| 06.01.2022 22:30 | 141 |
| 06.01.2022 22:15 | 155 |
© Bayerisches Landesamt für Umwelt 2024