
- Start >
- Rivers >
- Waterlevel >
- Iller - Lech - Bodensee >
- Landshut Birket >
- Chart of year

Chart of year Landshut Birket / Isar
Waterlevel from 30.03.2024 to 29.03.2025
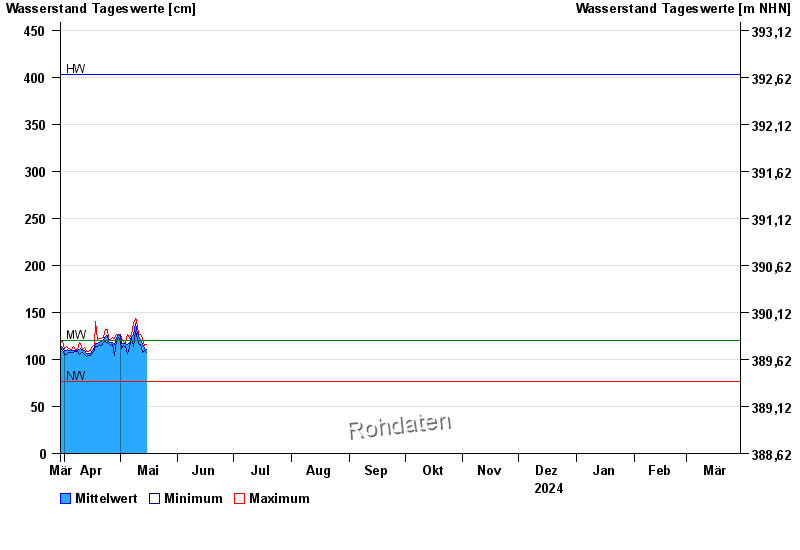
| Date | Mean value [cm] | Maximum [cm] | Minimum [cm] |
|---|---|---|---|
| 14.05.2024 | 112 | 115 | 110 |
| 13.05.2024 | 116 | 122 | 107 |
| 12.05.2024 | 120 | 126 | 116 |
| 11.05.2024 | 125 | 128 | 117 |
| 10.05.2024 | 132 | 141 | 126 |
| 09.05.2024 | 138 | 143 | 130 |
| 08.05.2024 | 127 | 138 | 114 |
© Bayerisches Landesamt für Umwelt 2024