
- Start >
- Rivers >
- Waterlevel >
- Iller - Lech - Bodensee >
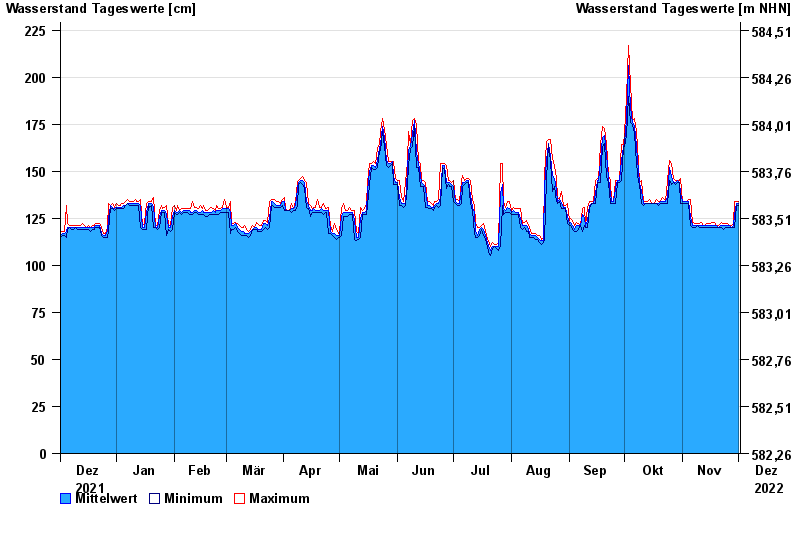
- Landsberg >
- Chart of year

Chart of year Landsberg / Lech
Waterlevel from 02.12.2021 to 01.12.2022
note
Messwerte beeinflusst durch Kraftwerkssteuerungen.
| Date | Mean value [cm] | Maximum [cm] | Minimum [cm] |
|---|---|---|---|
| 01.12.2022 | 133 | 134 | 132 |
| 30.11.2022 | 133 | 134 | 132 |
| 29.11.2022 | 127 | 134 | 120 |
| 28.11.2022 | 121 | 122 | 120 |
| 27.11.2022 | 120 | 121 | 120 |
| 26.11.2022 | 121 | 121 | 120 |
| 25.11.2022 | 121 | 122 | 120 |
© Bayerisches Landesamt für Umwelt 2024