
- Start >
- Rivers >
- Waterlevel >
- Iller - Lech - Bodensee >
- Günzburg u. d. Günzmündung >
- Chart of total period

Chart of total period Günzburg u. d. Günzmündung / Donau
Waterlevel from 01.11.1964 to 27.04.2024
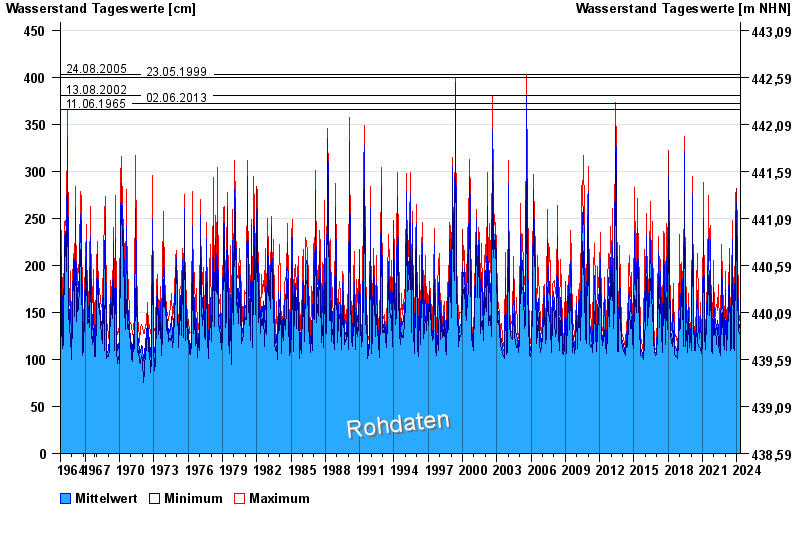
ACHTUNG
Abflussermittlung bei Niedrigwasser durch Kraftwerksbetrieb (Rückstau) beeinflusst.
- 24.08.2005 Wasserstand: 403 cm
- 23.05.1999 Wasserstand: 400 cm
- 13.08.2002 Wasserstand: 381 cm
- 02.06.2013 Wasserstand: 372 cm
- 11.06.1965 Wasserstand: 366 cm
| Date | Mean value [cm] | Maximum [cm] | Minimum [cm] |
|---|---|---|---|
| 27.04.2024 | 114 | 115 | 114 |
| 26.04.2024 | 117 | 121 | 113 |
| 25.04.2024 | 117 | 120 | 115 |
| 24.04.2024 | 117 | 120 | 114 |
| 23.04.2024 | 120 | 124 | 116 |
| 22.04.2024 | 125 | 131 | 121 |
| 21.04.2024 | 128 | 131 | 125 |
© Bayerisches Landesamt für Umwelt 2024