
- Start >
- Rivers >
- Waterlevel >
- Iller - Lech - Bodensee >
- Gschwend >
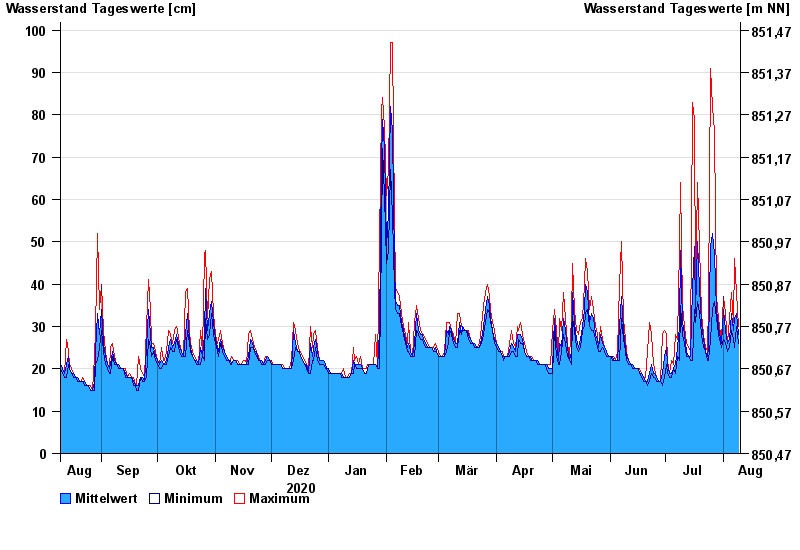
- Chart of year

Chart of year Gschwend / Rottach
Waterlevel from 10.08.2020 to 09.08.2021
- 23.08.2005 Wasserstand: 149 cm
- 12.08.2002 Wasserstand: 146 cm
- 01.06.2013 Wasserstand: 140 cm
- 06.08.2010 Wasserstand: 132 cm
- 18.07.1997 Wasserstand: 124 cm
| Date | Mean value [cm] | Maximum [cm] | Minimum [cm] |
|---|---|---|---|
| 09.08.2021 | 28 | 30 | 26 |
| 08.08.2021 | 33 | 38 | 30 |
| 07.08.2021 | 32 | 46 | 25 |
| 06.08.2021 | 29 | 31 | 27 |
| 05.08.2021 | 33 | 38 | 29 |
| 04.08.2021 | 27 | 32 | 25 |
| 03.08.2021 | 26 | 26 | 24 |
© Bayerisches Landesamt für Umwelt 2024