
- Start >
- Rivers >
- Waterlevel >
- Iller - Lech - Bodensee >
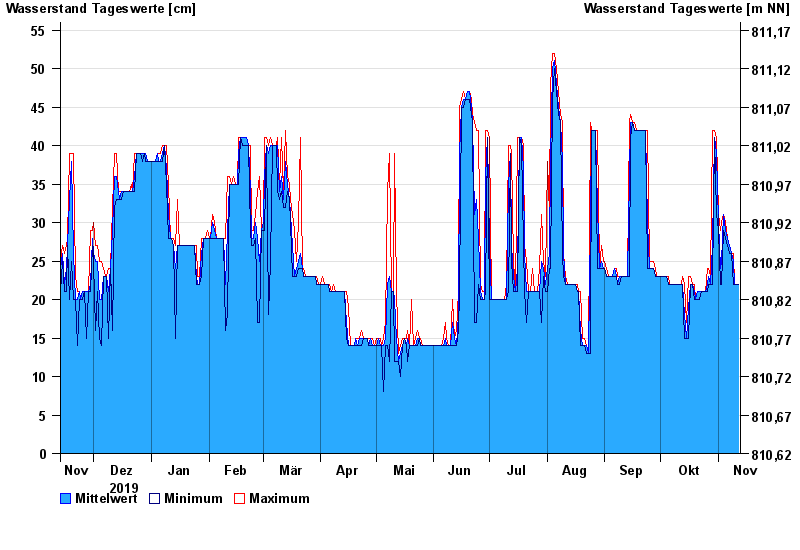
- Greifenmühle >
- Chart of year

Chart of year Greifenmühle / Rottach
Waterlevel from 13.11.2019 to 12.11.2020
- 10.08.1970 Wasserstand: 255 cm
- 08.08.1978 Wasserstand: 240 cm
- 18.06.1970 Wasserstand: 239 cm
- 10.06.1965 Wasserstand: 235 cm
- 07.06.1971 Wasserstand: 231 cm
| Date | Mean value [cm] | Maximum [cm] | Minimum [cm] |
|---|---|---|---|
| 12.11.2020 | 22 | 22 | 22 |
| 11.11.2020 | 22 | 22 | 22 |
| 10.11.2020 | 22 | 22 | 22 |
| 09.11.2020 | 25 | 26 | 22 |
| 08.11.2020 | 26 | 26 | 26 |
| 07.11.2020 | 27 | 27 | 26 |
| 06.11.2020 | 28 | 28 | 27 |
© Bayerisches Landesamt für Umwelt 2024