
- Start >
- Rivers >
- Waterlevel >
- Iller - Lech - Bodensee >
- Greifenmühle >
- Chart of year

Chart of year Greifenmühle / Rottach
Waterlevel from 01.01.2024 to 07.05.2024
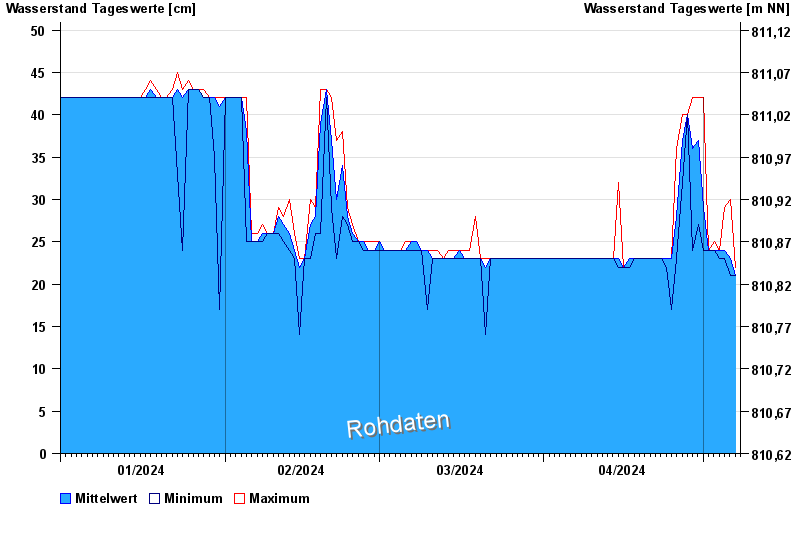
| Date | Mean value [cm] | Maximum [cm] | Minimum [cm] |
|---|---|---|---|
| 07.05.2024 | 21 | 22 | 21 |
| 06.05.2024 | 23 | 30 | 21 |
| 05.05.2024 | 24 | 29 | 23 |
| 04.05.2024 | 24 | 24 | 23 |
| 03.05.2024 | 24 | 25 | 24 |
| 02.05.2024 | 24 | 24 | 24 |
| 01.05.2024 | 29 | 42 | 24 |
© Bayerisches Landesamt für Umwelt 2024