
- Start >
- Rivers >
- Waterlevel >
- Iller - Lech - Bodensee >
- Görisried >
- Chart of year

Chart of year Görisried / Waldbach
Waterlevel from 01.01.2024 to 31.12.2024
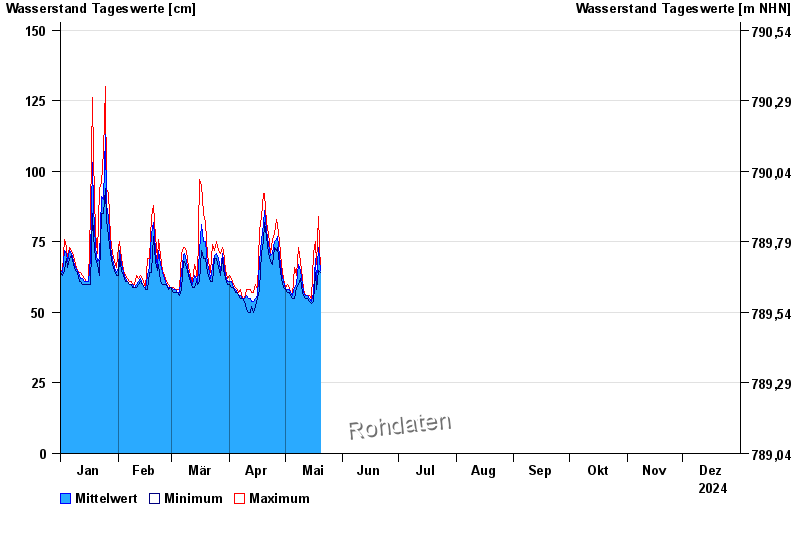
| Date | Mean value [cm] | Maximum [cm] | Minimum [cm] |
|---|---|---|---|
| 19.05.2024 | 73 | 84 | 65 |
| 18.05.2024 | 61 | 67 | 58 |
| 17.05.2024 | 69 | 75 | 64 |
| 16.05.2024 | 57 | 71 | 54 |
| 15.05.2024 | 54 | 55 | 53 |
| 14.05.2024 | 55 | 56 | 54 |
| 13.05.2024 | 56 | 56 | 55 |
© Bayerisches Landesamt für Umwelt 2024