
- Start >
- Rivers >
- Waterlevel >
- Iller - Lech - Bodensee >
- Füssen >
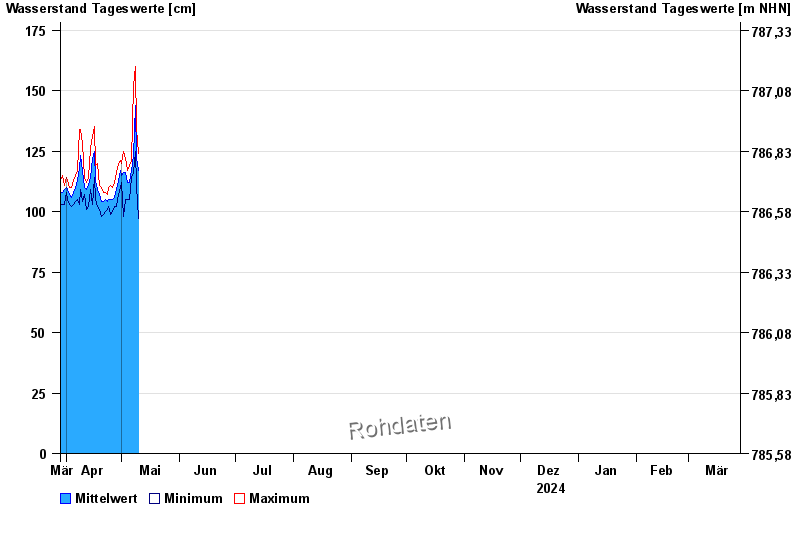
- Chart of year

Chart of year Füssen / Lech
Waterlevel from 29.03.2024 to 28.03.2025
| Date | Mean value [cm] | Maximum [cm] | Minimum [cm] |
|---|---|---|---|
| 05.06.2024 | 171 | 174 | 167 |
| 04.06.2024 | 184 | 218 | 161 |
| 03.06.2024 | 214 | 246 | 154 |
| 02.06.2024 | 156 | 182 | 139 |
| 01.06.2024 | 195 | 204 | 180 |
| 31.05.2024 | 171 | 198 | 146 |
| 30.05.2024 | 126 | 145 | 115 |
© Bayerisches Landesamt für Umwelt 2024