
- Start >
- Rivers >
- Waterlevel >
- Iller - Lech - Bodensee >
- Füssen >
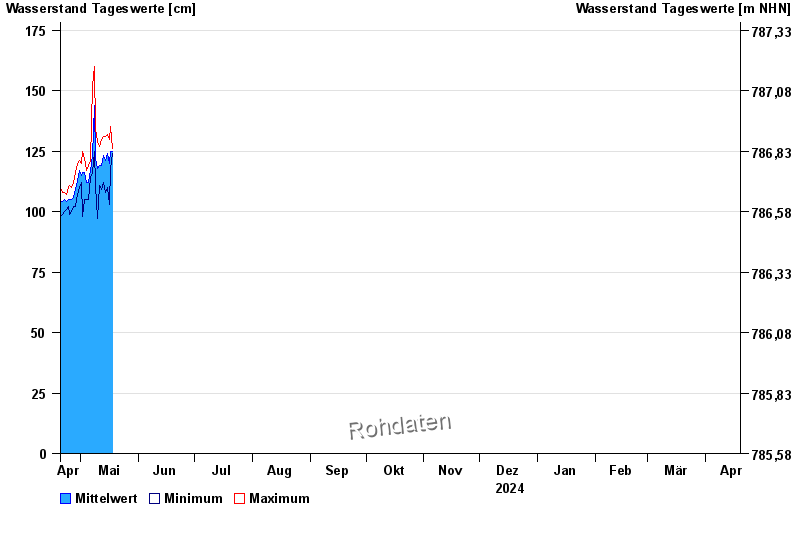
- Chart of year

Chart of year Füssen / Lech
Waterlevel from 20.04.2024 to 19.04.2025
 Für diesen Pegel sind keine Meldestufen hinterlegt.
| Date | Mean value [cm] | Maximum [cm] | Minimum [cm] |
|---|---|---|---|
| 03.05.2024 | 120 | 122 | 119 |
| 02.05.2024 | 116 | 125 | 98 |
| 01.05.2024 | 115 | 120 | 112 |
| 30.04.2024 | 117 | 121 | 110 |
| 29.04.2024 | 113 | 120 | 107 |
| 28.04.2024 | 109 | 116 | 102 |
| 27.04.2024 | 106 | 112 | 102 |
© Bayerisches Landesamt für Umwelt 2024