
- Start >
- Rivers >
- Waterlevel >
- Iller - Lech - Bodensee >
- Eschach >
- Chart of year

Chart of year Eschach / Füssener Achen
Waterlevel from 30.03.2024 to 29.03.2025
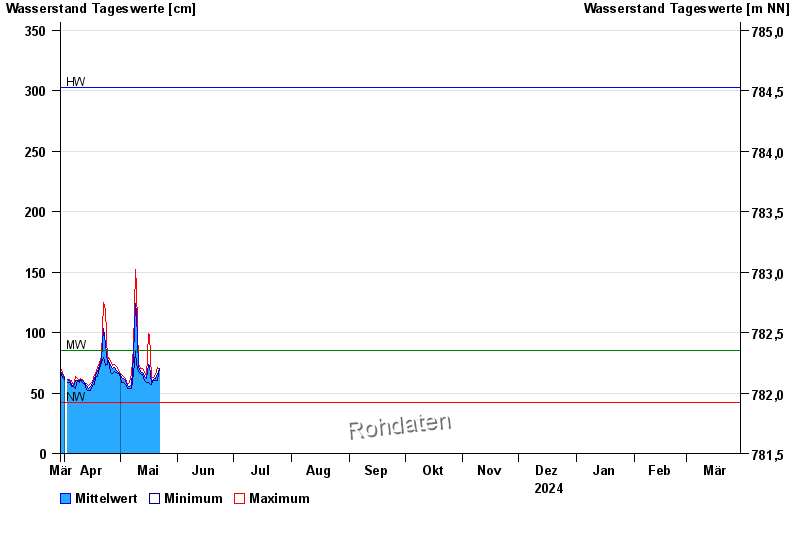
| Date | Mean value [cm] | Maximum [cm] | Minimum [cm] |
|---|---|---|---|
| 18.06.2024 | 76 | 77 | 74 |
| 17.06.2024 | 79 | 81 | 78 |
| 16.06.2024 | 82 | 84 | 80 |
| 15.06.2024 | 81 | 83 | 76 |
| 14.06.2024 | 79 | 82 | 78 |
| 13.06.2024 | 90 | 104 | 80 |
| 12.06.2024 | 109 | 113 | 104 |
© Bayerisches Landesamt für Umwelt 2024