
- Start >
- Rivers >
- Waterlevel >
- Iller - Lech - Bodensee >
- Eschach >
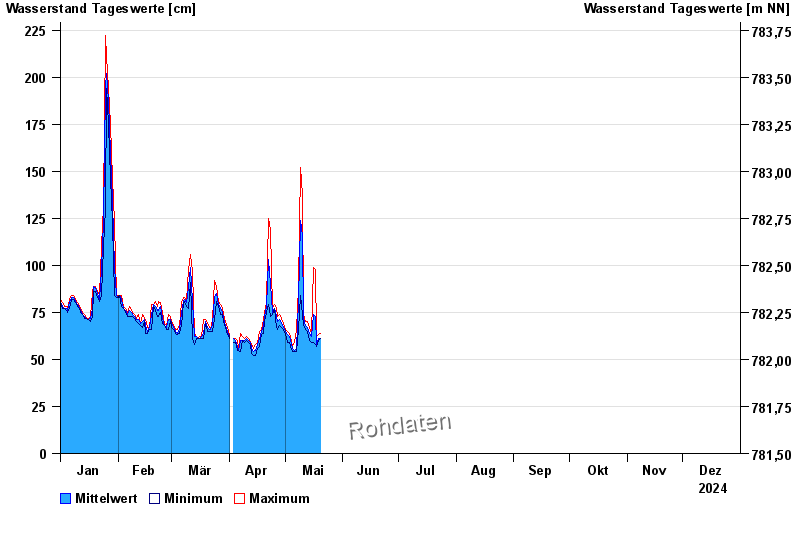
- Chart of year

Chart of year Eschach / Füssener Achen
Waterlevel from 01.01.2024 to 31.12.2024
 Für diesen Pegel sind keine Hochwassermarken hinterlegt.
| Date | Mean value [cm] | Maximum [cm] | Minimum [cm] |
|---|---|---|---|
| 10.05.2024 | 137 | 137 | 136 |
| 09.05.2024 | 124 | 152 | 84 |
| 08.05.2024 | 81 | 88 | 66 |
| 07.05.2024 | 56 | 66 | 54 |
| 06.05.2024 | 55 | 59 | 54 |
| 05.05.2024 | 56 | 57 | 54 |
| 04.05.2024 | 60 | 62 | 57 |
© Bayerisches Landesamt für Umwelt 2024