
- Start >
- Rivers >
- Waterlevel >
- Iller - Lech - Bodensee >
- Birgsau >
- Chart of total period

Chart of total period Birgsau / Stillach
Waterlevel from 07.10.2004 to 01.05.2024
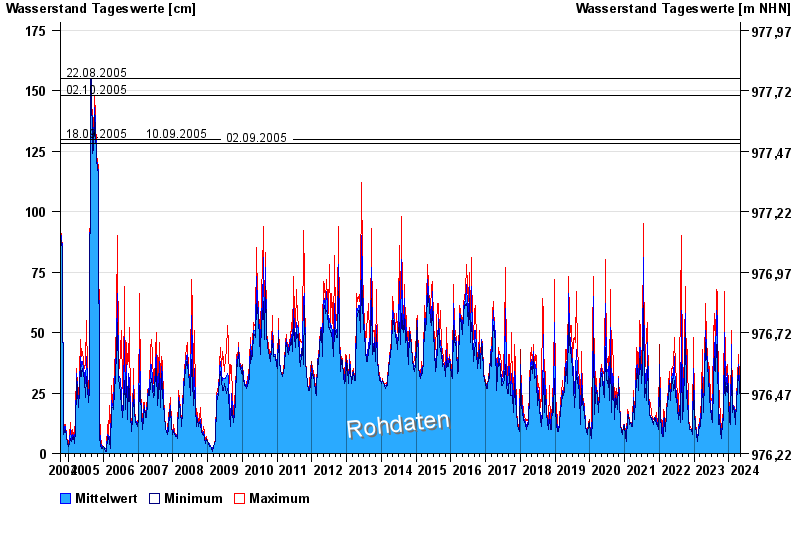
- 22.08.2005 Wasserstand: 155 cm
- 02.10.2005 Wasserstand: 148 cm
- 18.09.2005 Wasserstand: 130 cm
- 10.09.2005 Wasserstand: 130 cm
- 02.09.2005 Wasserstand: 128 cm
| Date | Mean value [cm] | Maximum [cm] | Minimum [cm] |
|---|---|---|---|
| 01.05.2024 | 34 | 37 | 32 |
| 30.04.2024 | 32 | 35 | 29 |
| 29.04.2024 | 28 | 32 | 25 |
| 28.04.2024 | 25 | 30 | 22 |
| 27.04.2024 | 18 | 23 | 16 |
| 26.04.2024 | 16 | 17 | 15 |
| 25.04.2024 | 15 | 16 | 15 |
© Bayerisches Landesamt für Umwelt 2024